At stock market close the Dow Jones Industrial Average (DIA) had fallen 208 points to lose 1.36%, the S&P 500 (SPY) dropped 1.43%, the Nasdaq (QQQ) declined 1% and the Russell 2000 (IWM) closed the day with a loss of 1.04%.
But May was still positive for the major market indexes as the Dow Jones Industrial Average (DIA) added 1.9%, the S&P 500 (SPPY) gained 2.1% and the Nasdaq was up 3.7%.
On My ETF Radar
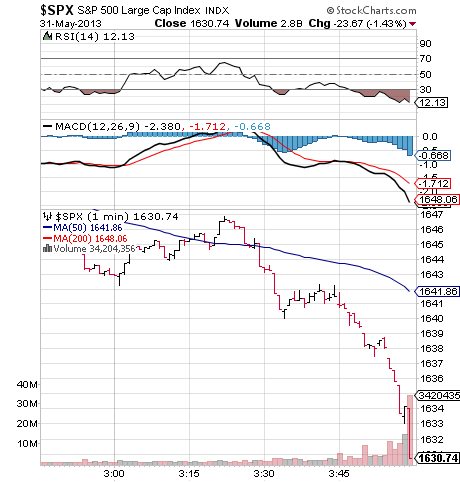
In the chart of the S&P 500 (SPY) below, we can see how the market traded sharply lower in the closing minutes of the trading day. Markets were apparently spooked by the ongoing rise in interest rates and reports of a “Hindenburg Omen” forming. This was the second Hindenburg sighting within the last six weeks, with the first one coming on April 15th and the current one on May 29th.
Also troubling markets have been recent comments by Fed Chairman Ben Bernanke regarding the potential tapering of the Fed’s quantitative easing program, the growing disconnect between economic fundamentals and market action, the divergences between stocks, bonds and commodities like copper lumber and gold, and the recent volatility in Japanese financial markets
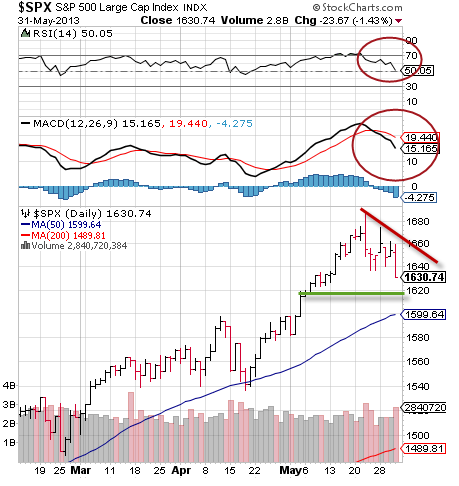
A longer term view of the stock market shows that the S&P 500 has now reached significant support and that further declines could open the door for yet lower prices ahead.
In this longer range view of the S&P 500, we can see how relative strength has fallen from overbought levels, MACD is on a “sell” signal and the interim trend is down after recent highs were reached. Next strong support is at 1620-1630 and a decline below that point would set the stage for a fall to the 1580 region. A broader decline could be expected to take the index down to the 1560 level which is a major area of support and the Fibonacci 62% retracement level.
Other red flags for the intermediate term are that margin interest is at record high levels and complacency has been extreme, which would point to the possibility of too many people being on the same side of the boat at the same time. Also, recession in Europe and a dramatically slowing Chinese economy are significant factors, while rising unemployment due to sequestration cuts and a downgrade in consumer headwinds will add significant drag to the U.S. economy.
Finally, in a little reported event, on Wednesday, Moody’s downgraded Alcoa to junk status. Alcoa’s credit is now Ba1 with a stable outlook which is significant because Alcoa is a member of the Dow Jones Industrial Average and widely seen as an economic bellwether in its position as a major global aluminum supplier. A slowdown in demand for aluminum is viewed as a precursor for slowing economic activity, much like copper and lumber, and so weakness here confirms other indications of a slowing global economy. Alcoa typically kicks off earnings season and so its next report in early July could be interesting and will be carefully scrutinized for signs of weakness in the macro economy.
ETF News You Can Really Use
For the week, economic news was mixed as the Case/Shiller Home Price Index showed a strong updraft in housing prices with a gain of 10.9% year over year. Three other closely watched economic reports also posted positive numbers with consumer confidence and sentiment rising in May and the Chicago PMI registering 58.7.
Bad news came from pending home sales which missed expectations, and consumer spending and income which were both weak and below expectations and reflected a consumer pulling back on spending while incomes remain flat.
Initial jobless claims spiked higher on Thursday to 354,000 on expectations of 341,000 and the revised GDP report showed the U.S. economy limping along at 2.4%, well below normal recoveries and below expectations for Q1.
Next week brings a raft of important economic reports:
Monday: Markit PMI, Construction spending, ISM, motor vehicle sales
Wednesday: ADP Private Employment, ISM services, Fed Beige book, factory orders
Thursday: weekly jobless claims
Friday: May Non Farm Payrolls, May Unemployment
Of course, the big hitters here will be the ISM reports and Friday’s employment reports which everyone will be slicing and dicing for clues about the Federal Reserve’s next step in quantitative easing. The market doesn’t seem to know whether to cheer good news or bad news, as good news increases the likelihood for a sooner end to quantitative easing and bad news portends lower earnings, a slowing global economy and potentially lower stock prices.
Other action will take place with an interest rate announcement from the European Central Bank and investors will closely be watching the ongoing volatility in Japan for clues that similar action could spread to U.S. financial markets. Japan’s bond market is the second largest in the world to the United States’ and so upheaval there could present potential complications for the U.S. market.
Finally, the biggest recent news is the sharp spike in interest rates which could be a significant game changer for the U.S. stock market and economy.
10 Year Treasuries jumped to 2.1% on Friday, which is up from 1.6% at the beginning of the month. After a long period of low interest rates, U.S. financial markets are used to easy, cheap money and a change in that environment will add to the cost of doing business for corporations, dampened the much ballyhooed real estate resurgence and have the ominous effect of increasing the national debt as rising interest rates make the debt more expensive.
Reasons for the recent rate hike seem to be centered on fears for the end of quantitative easing or the possibility that the economy is growing stronger and so rising rates are actually a good sign. However, many analysts point to the potential for a bond bubble as money has gushed into bond funds in recent years and that rising rates could pop a sudden and significant hole in that bubble.
The net outcome of the recent rate hike in Treasuries (IEF) is that the 10 Year yield last week came even to the S&P 500 (SPY) dividend yield. This decline in yield premium in the S&P 500 could put a huge damper on the recent stock market rally and the so called “Great Rotation” from bonds to stocks as investors might now start looking more to the bond market than the stock market for yield since the bond market is widely viewed as a less volatile and lower risk environment.
Overall, this leaves investors in a bad place with growing potential risks in the stock and bond markets. On Friday, both stocks and bond prices declined, which is not the typical action in which stock prices and bond prices move inversely to each other. If stock prices and bond prices (NYSEARCA:IEF) start going down together, this potentially sets up an environment wherein a “diversified” portfolio of stocks and bonds could move up or down in tandem. The biggest risk here is that the Fed easy money policy has created three simultaneous bubbles in stocks, bonds and real estate and that all three could deflate concurrently if/when the easy money is pulled away. Any hint that the Fed is losing control of the interest rate environment is likely to lead to extreme volatility and the potential for significant problems for stocks, bonds and real estate.
Bottom line: U.S. markets have been technically overbought, unhinged from economic reality and in an unsustainable rally since mid-April. Recent technical action appears to confirm at least an interim swing top, and macro economic conditions, including rising interest rates and falling bond prices, point to the potential for an increasingly high risk environment ahead.
Disclaimer: The content included herein is for educational and informational purposes only, and readers agree to Wall Street Sector Selector's Disclaimer, Terms of Use, and Privacy Policy before accessing or using this or any other publication by Wall Street Sector Selector or Ridgeline Media Group, LLC.
- English (UK)
- English (India)
- English (Canada)
- English (Australia)
- English (South Africa)
- English (Philippines)
- English (Nigeria)
- Deutsch
- Español (España)
- Español (México)
- Français
- Italiano
- Nederlands
- Português (Portugal)
- Polski
- Português (Brasil)
- Русский
- Türkçe
- العربية
- Ελληνικά
- Svenska
- Suomi
- עברית
- 日本語
- 한국어
- 简体中文
- 繁體中文
- Bahasa Indonesia
- Bahasa Melayu
- ไทย
- Tiếng Việt
- हिंदी
Stock Market Tanks In Last 30 Minutes: What Next?
Published 06/03/2013, 12:43 AM
Updated 05/14/2017, 06:45 AM
Stock Market Tanks In Last 30 Minutes: What Next?
After shaking off poor spending and income reports, the major U.S. stock market indexes traded mostly higher for the last day of May, however, a bout of heavy selling hit the tape just before 3:30 p.m.
3rd party Ad. Not an offer or recommendation by Investing.com. See disclosure here or
remove ads
.
Latest comments
Install Our App
Risk Disclosure: Trading in financial instruments and/or cryptocurrencies involves high risks including the risk of losing some, or all, of your investment amount, and may not be suitable for all investors. Prices of cryptocurrencies are extremely volatile and may be affected by external factors such as financial, regulatory or political events. Trading on margin increases the financial risks.
Before deciding to trade in financial instrument or cryptocurrencies you should be fully informed of the risks and costs associated with trading the financial markets, carefully consider your investment objectives, level of experience, and risk appetite, and seek professional advice where needed.
Fusion Media would like to remind you that the data contained in this website is not necessarily real-time nor accurate. The data and prices on the website are not necessarily provided by any market or exchange, but may be provided by market makers, and so prices may not be accurate and may differ from the actual price at any given market, meaning prices are indicative and not appropriate for trading purposes. Fusion Media and any provider of the data contained in this website will not accept liability for any loss or damage as a result of your trading, or your reliance on the information contained within this website.
It is prohibited to use, store, reproduce, display, modify, transmit or distribute the data contained in this website without the explicit prior written permission of Fusion Media and/or the data provider. All intellectual property rights are reserved by the providers and/or the exchange providing the data contained in this website.
Fusion Media may be compensated by the advertisers that appear on the website, based on your interaction with the advertisements or advertisers.
© 2007-2024 - Fusion Media Limited. All Rights Reserved.
