As we note often, context plays a vital role in the development of reliable market forecasts. Short-term price behavior only has meaning when analyzed in the proper context afforded by the long-term view, so all investing and trading strategies should begin with a thorough understanding of the current secular environment. There have been five secular trends in the stock market since the crash in 1929, three downtrends and two uptrends.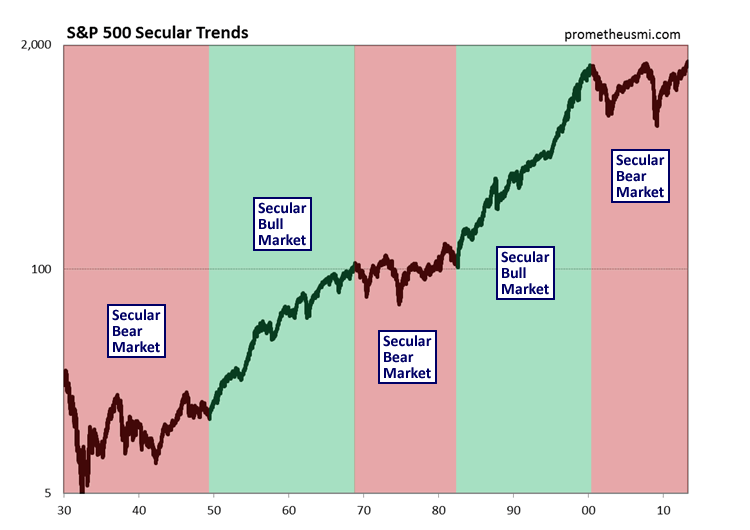
The current secular bear market began in 2000 following a speculative run-up during the second half of the 1990s. As usual, market behavior clearly signaled that a secular inflection point was approaching and our Secular Trend Score (STS), which analyzes a large basket of fundamental, internal, technical and sentiment data, issued a long-term sell signal in December 1999. At the time, our computer models predicted that stocks would enter a secular bear market that would last from 10 to 20 years. Following the topping process in 2000, a prototypical secular downtrend began that continues today.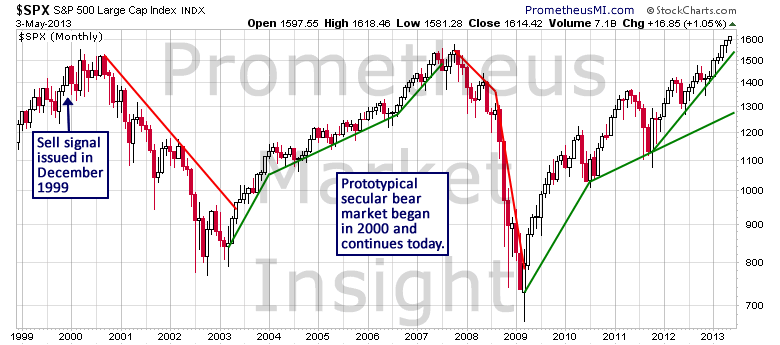
Severe secular bear markets such as this one are nearly always accompanied by extremely weak economic activity and the first decade of this century was characterized by the lowest real GDP growth since the Great Depression.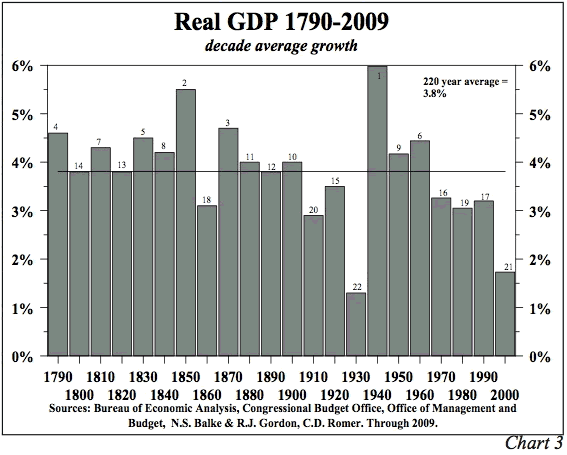
Stock market secular trends typically last from 10 to 20 years, depending upon the nature of underlying structural economic trends. Since we are currently in the final stage of a debt expansion cycle that began 60 years ago, it is highly likely that the current secular bear market is still several years away from its terminal phase.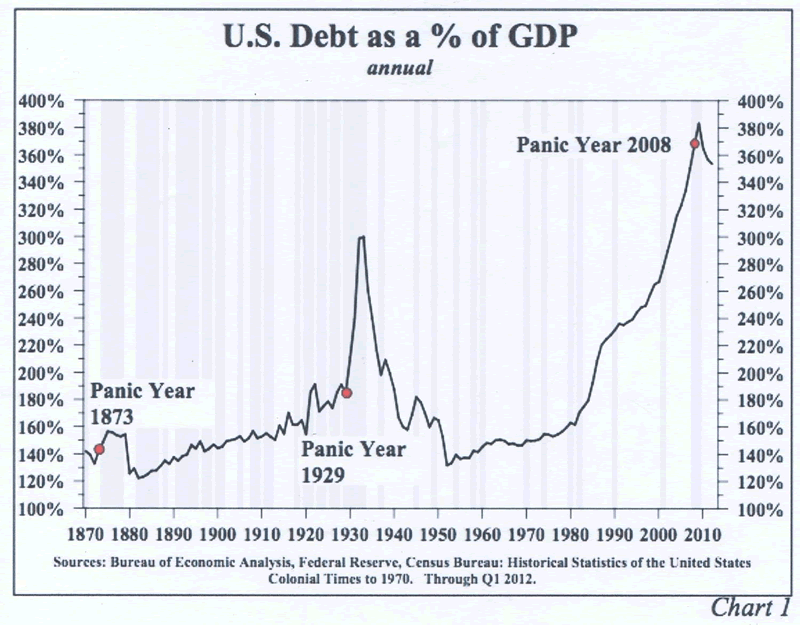
The STS supports the hypothesis that this secular downtrend is far from over as the score has yet to return to positive territory following the sell signal in 1999. Secular inflection points develop slowly, usually over the course of 6 to 12 months, so the STS will provide plenty of advance warning when the next true investment opportunity develops in the stock market.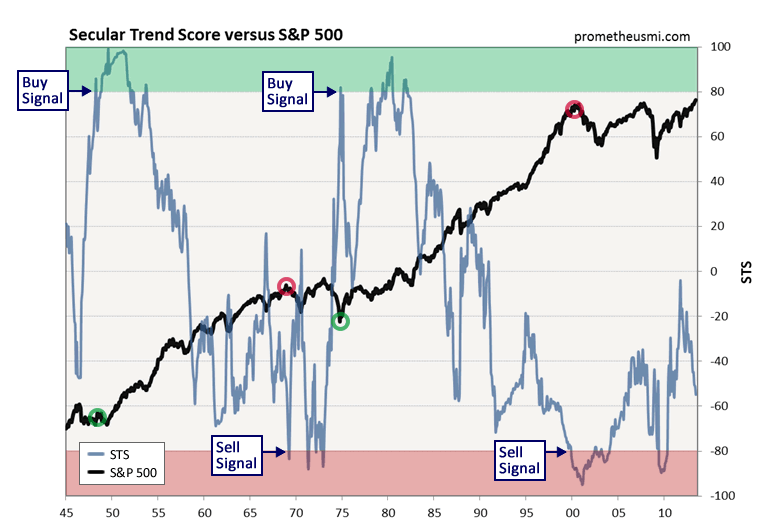
Secular trends are themselves composed of cyclical subcomponents, and the current cyclical uptrend began in March 2009. When they occur during secular bear markets, cyclical rallies have an average duration of 33 months. At a current duration of 50 months, the bull market from 2009 is long overdue for termination and it will likely be followed by a violent overbought correction.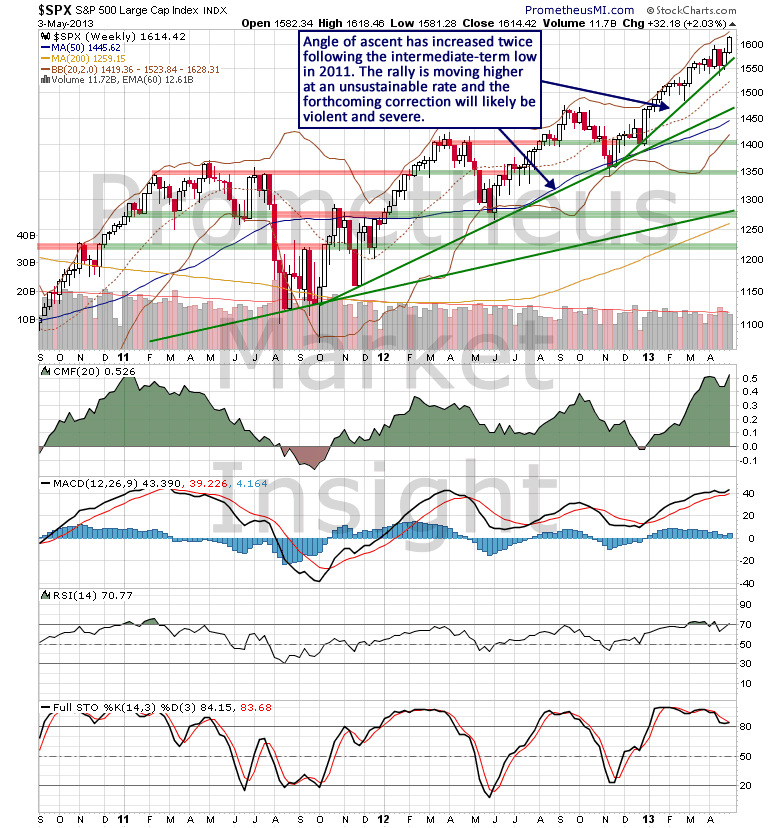
The final phase of the previous cyclical bull market from 2002 was easy to identify as it developed in 2007. The measured move higher from 2004 until 2006 was followed by a speculative blow-off rally that terminated the advance in prototypical fashion. The historic amount of Federal Reserve stimulus introduced during the last four years, targeted directly at risk assets such as stocks, has created massive market distortions, causing the current cyclical bull to be characterized by violent moves in both directions. However, the last advance off of the low in 2011 is rising at an unsustainable rate, suggesting that the rally has entered its final phase.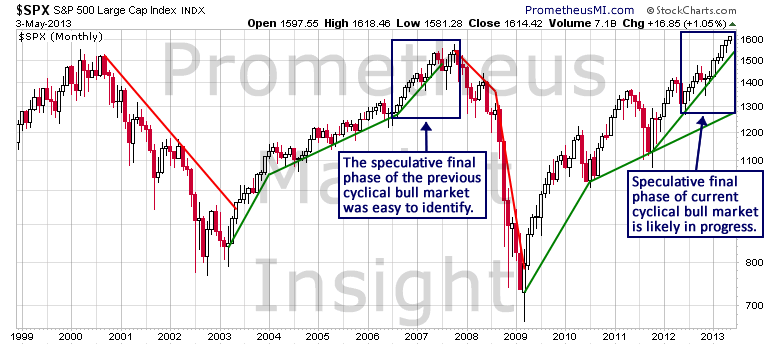
Another way to model an unsustainable advance is via a log periodic bubble. This mathematical formula replicates market behavior extremely well during highly speculative uptrends and the following chart from a recent weekly commentary at the Hussman Funds website displays the high degree to which the current stock market rally is exhibiting the classic characteristics of a bubble. Therefore, the next cyclical top is almost certainly imminent and it could form at any time.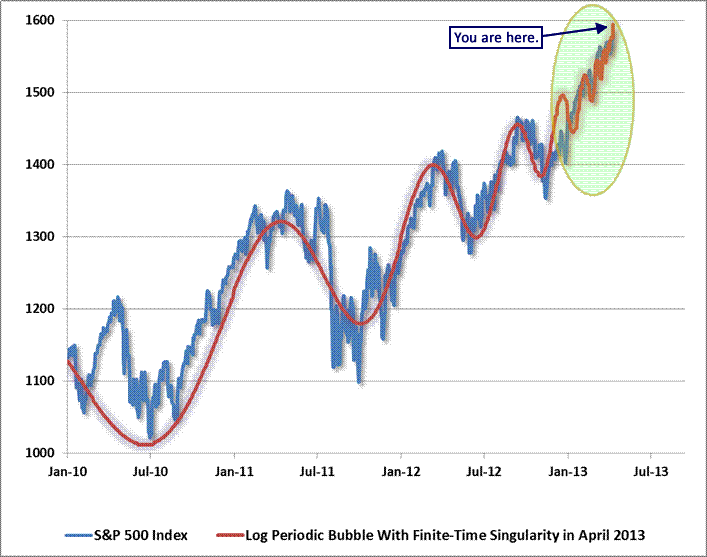
Additionally, it is important to remember that stock market investment risk continues to hold near the highest level ever recorded. Anything can happen over short-term time periods, but the key to having consistent success over the long run as an investor and a trader is to stay aligned with the most likely scenarios and protect yourself from the unlikely ones. There will come a time when the risk/reward profile of stocks is once again favorable and the judicious study of market data will signal when that next long opportunity develops, just as it did in March 2009. However, now is a time for extreme caution and we remain fully defensive from an investment perspective.
- English (UK)
- English (India)
- English (Canada)
- English (Australia)
- English (South Africa)
- English (Philippines)
- English (Nigeria)
- Deutsch
- Español (España)
- Español (México)
- Français
- Italiano
- Nederlands
- Português (Portugal)
- Polski
- Português (Brasil)
- Русский
- Türkçe
- العربية
- Ελληνικά
- Svenska
- Suomi
- עברית
- 日本語
- 한국어
- 简体中文
- 繁體中文
- Bahasa Indonesia
- Bahasa Melayu
- ไทย
- Tiếng Việt
- हिंदी
Stock Market Secular Trend Review
Published 05/06/2013, 12:31 AM
Updated 07/09/2023, 06:31 AM
Stock Market Secular Trend Review
Latest comments
Loading next article…
Install Our App
Risk Disclosure: Trading in financial instruments and/or cryptocurrencies involves high risks including the risk of losing some, or all, of your investment amount, and may not be suitable for all investors. Prices of cryptocurrencies are extremely volatile and may be affected by external factors such as financial, regulatory or political events. Trading on margin increases the financial risks.
Before deciding to trade in financial instrument or cryptocurrencies you should be fully informed of the risks and costs associated with trading the financial markets, carefully consider your investment objectives, level of experience, and risk appetite, and seek professional advice where needed.
Fusion Media would like to remind you that the data contained in this website is not necessarily real-time nor accurate. The data and prices on the website are not necessarily provided by any market or exchange, but may be provided by market makers, and so prices may not be accurate and may differ from the actual price at any given market, meaning prices are indicative and not appropriate for trading purposes. Fusion Media and any provider of the data contained in this website will not accept liability for any loss or damage as a result of your trading, or your reliance on the information contained within this website.
It is prohibited to use, store, reproduce, display, modify, transmit or distribute the data contained in this website without the explicit prior written permission of Fusion Media and/or the data provider. All intellectual property rights are reserved by the providers and/or the exchange providing the data contained in this website.
Fusion Media may be compensated by the advertisers that appear on the website, based on your interaction with the advertisements or advertisers.
© 2007-2024 - Fusion Media Limited. All Rights Reserved.
