Technical evidence of late has been suggesting that market risk has been elevated. However, the trend of major market indexes was up. A month has past and this is still the case.
What does this mean?
The stock market can continue to advance even in the face of deteriorating market technicals. However, internal weakness simply increases the odds of a correction. As an investor, it is important to use this information to determine the amount of risk you are willing to take with your investment allocations. For me, when stock market risk is high, I want to be cautious. This often means being under-allocated in equities.
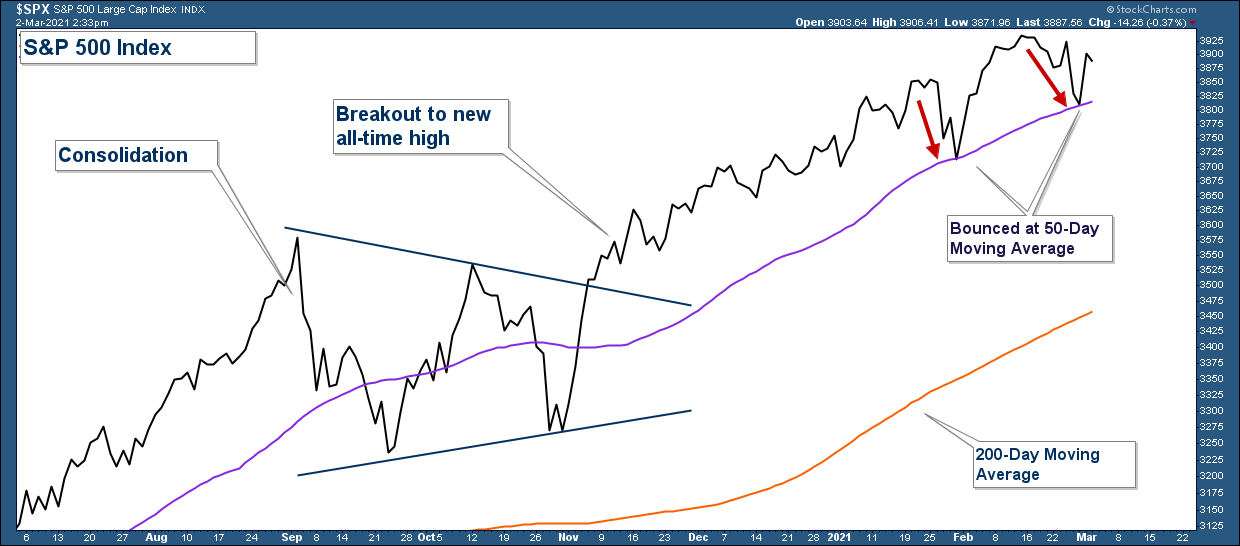
Let’s start by looking at a daily chart of the S&P 500, which is our stock market proxy. As you will notice, the index is above both its 50- and 200-day moving averages and both those averages are trending higher. Therefore, the market is in an uptrend.
There are other things to be cognizant of regarding this chart. First, the index broke out of a consolidation pattern in November. These types of patterns allow us to determine a target area for the following advance. The projected advance above the consolidation pattern is equal to the advance that preceded the consolidation. It is not notated, but the index is currently at that target. Of course, this does not guarantee the advance will always end right at this area; however, it a useful tool.
Second, the index had two strong moves down (notated with red arrows) that both bounced right at the 50-day moving average. This average seems to be providing investors with a psychological risk backstop or advancing level of support. This will be an area to watch going forward. If the index closes below this moving average, it would provide investors a technical reason to sell.
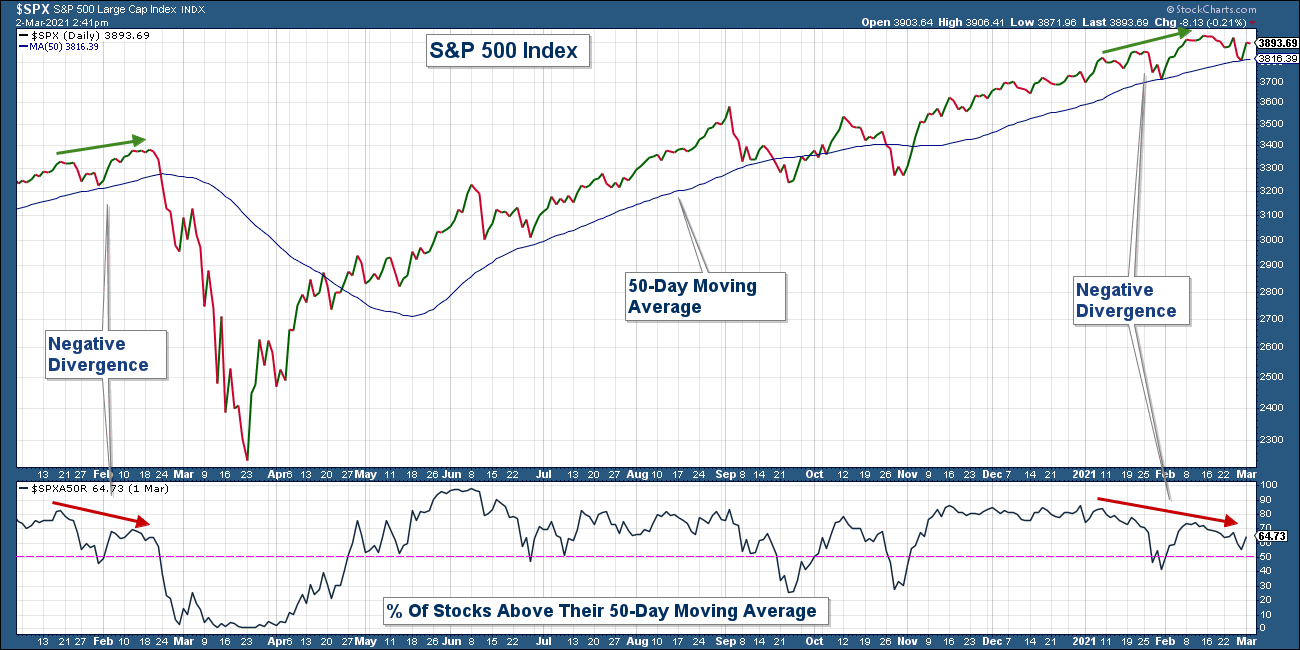
While the S&P 500 index continues to trade above its 50-day moving average, the number of stocks within that index are increasingly falling below their respective 50-day moving averages, which can be seen in the chart below.
In the upper panel is the S&P 500 index and in the lower panel is the number of stocks within that index that are above their 50-day moving averages. Notice how the line in the lower panel is falling which means the number of individual stocks above their respective moving averages is progressively falling. This is occurring as the index is rising which is considered a negative divergence and is a red flag. Also, notice how the major correction that occurred last year was preceded by a similar divergence.
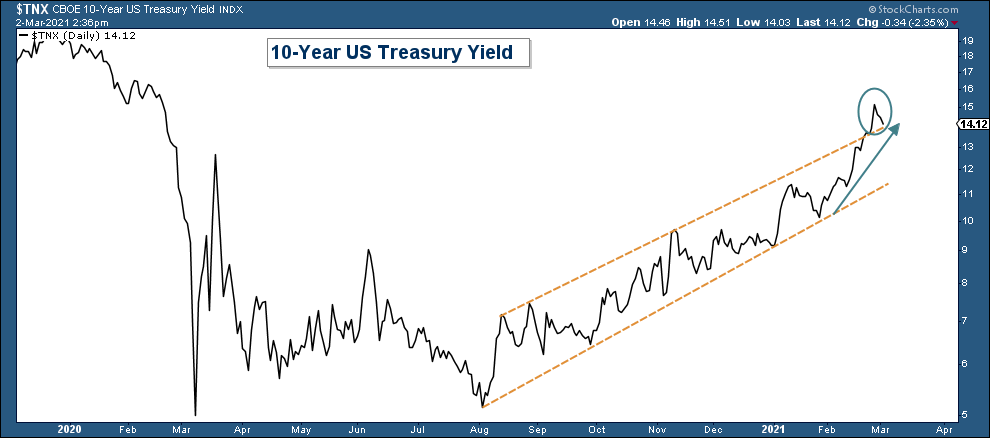
Bond yields have advanced strongly over the past month and that has the stock market worried. What is concerning is not the fact that yields are rising, but that they are advancing so strongly.
Below is a chart of the 10-Year U.S. Treasury yield. You can see that it is advancing within an up-trending channel. After touching the bottom of the channel at the end of January, it shot straight up and advanced above the top end of the channel. If yields keep advancing at an accelerated rate, it will definitely have a negative effect on most stocks.
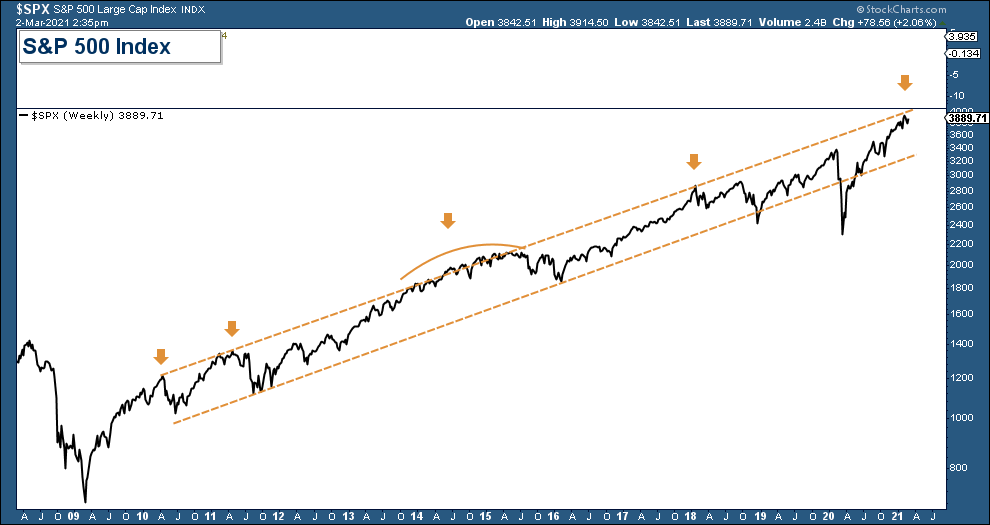
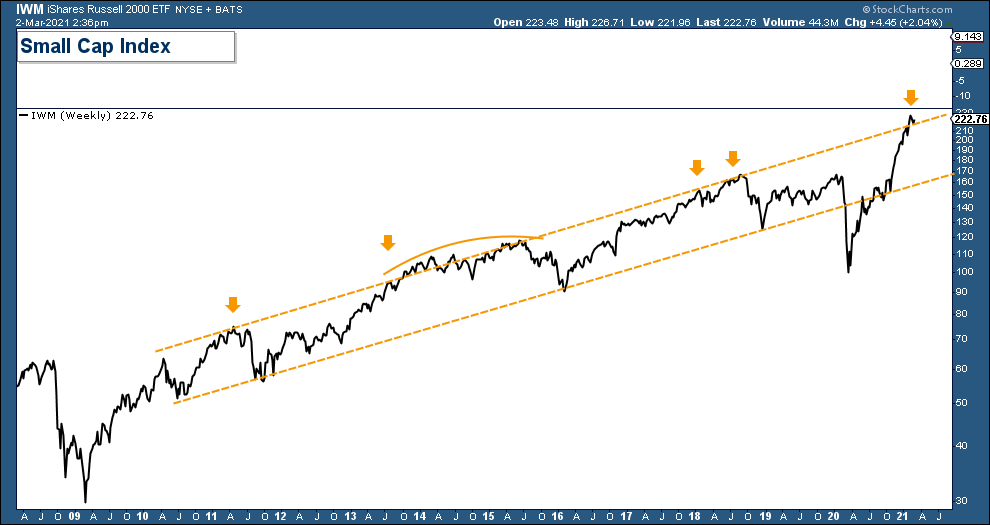
Also concerning is the fact that major market indexes are extended over a long-term basis. Below is a chart of the S&P 500 going back to 2009. Each time price historically has reached the upper end of the price channel it has corrected. Sometimes it continued to climb higher only to eventually fall back to the lower end of the channel.
Small-Cap stocks have been outperforming the broader market but they are also extended.
Market internals continue to suggest elevated short-term market risk. If the S&P 500 closes below its 50-day moving average, it would probably invite more selling and possibly a change in trend.
