As we’ve been saying, the stock market will have great influence on gold. It has been easy to see in recent months.
The S&P 500 has cracked, losing both its 200-day and 400-day moving averages. Gold and gold stocks have benefited and gained in recent months even with a stable to rising US dollar.
The past 65 years of history shows us that in almost any context (but not all) the time between the Fed’s last rate hike and first rate cut is exactly when you want to buy gold stocks.
We don’t know if December is the last rate hike. No one does.
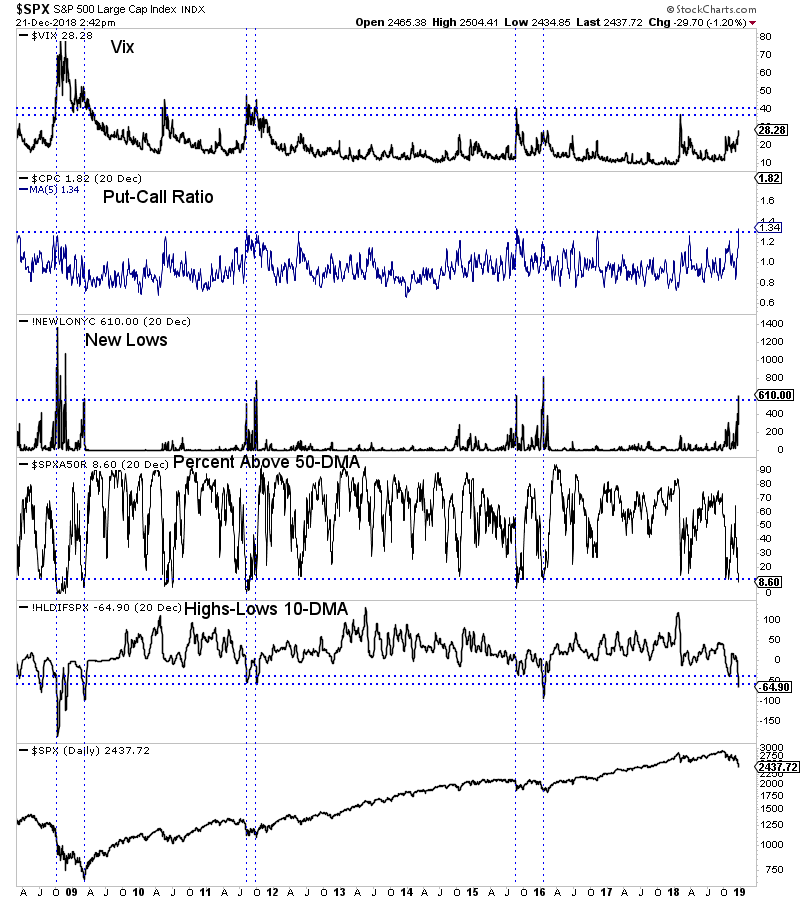
What we do know is the stock market is approaching an extreme oversold condition and is likely to begin a counter trend rally very soon.
In the chart below we plot five indicators that can help define an extreme oversold condition. These include the VIX, the put-call ratio and several breadth indicators. All but the VIX are in extreme oversold territory.

As we pen this article, the S&P 500 is trading at 2436. (Ed. Note: It finished the week at 2416.63)
The 40-month moving average, which has provided key support and resistance over the past 20 years (including the 2016 and 2011 lows) is at 2395 while the 50% retracement of the 2016 to 2018 advance is at 2380. The setup for a bullish reversal is in place.
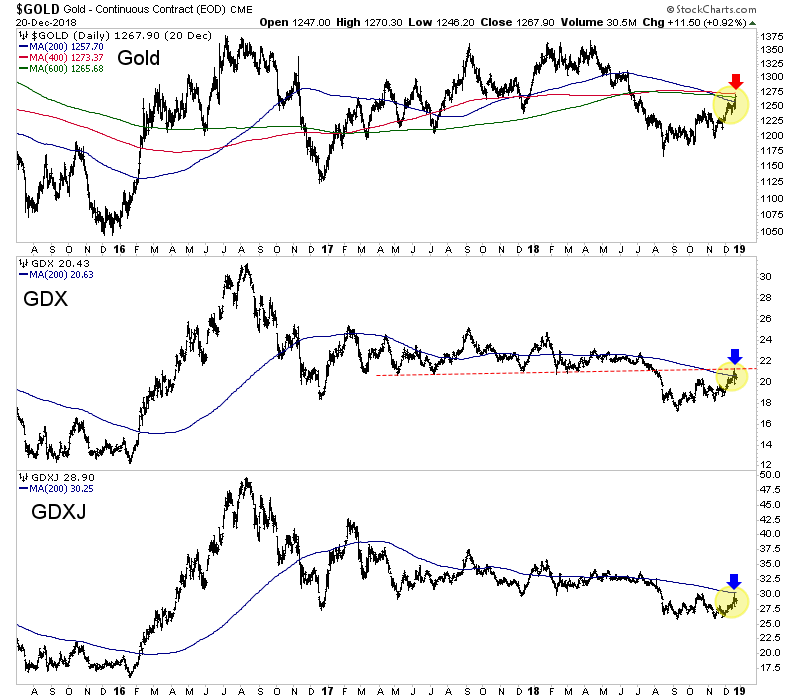
Meanwhile, despite the recent carnage in stocks, precious metals have been unable to surpass resistance. Gold is set to close the week right below a confluence of resistance at $1260-$1270. Perhaps it will close right on its 200-day moving average at $1258.
The gold stocks (VanEck Vectors Gold Miners (NYSE:GDX), VanEck Vectors Junior Gold Miners (NYSE:GDXJ)) have been strong since Thanksgiving but appear to have been turned back at their 200-day moving averages.

So in recent days the selloff in the S&P 500 accelerated but precious metals (at least to this point) failed to capitalize in a bullish fashion. If the S&P 500 is within one or two days of a rally then we should not expect much more upside in Gold and GDX in particular. Those were the markets that benefited most from weakness in the S&P 500.
As we noted last week, the weakness in the stock market (and the economy) has not done enough to change Fed policy yet.
Over the past 65 years, the start of bull markets and big rallies in gold stocks coincided with the start of rate cuts. When the market sniffs the first rate cut, we will know precious metals are beginning a sustained advance and not another false start.
Until Gold proves its in a bull market (and the market begins pricing in a rate cut) it would not be wise to chase strength. There will be plenty of time to get into cheap juniors that can triple and quadruple once things really get going.
