
There are a few important inflection points to look at today and the first of those is on the S&P 500 Large Cap Index (SPX). On the daily chart, SPX closed well above the daily middle Bollinger Band® and significantly over the 50 DMA. This resistance break would usually extend into a test of the daily upper bollinger band, now in the 1658 area. SPX daily chart: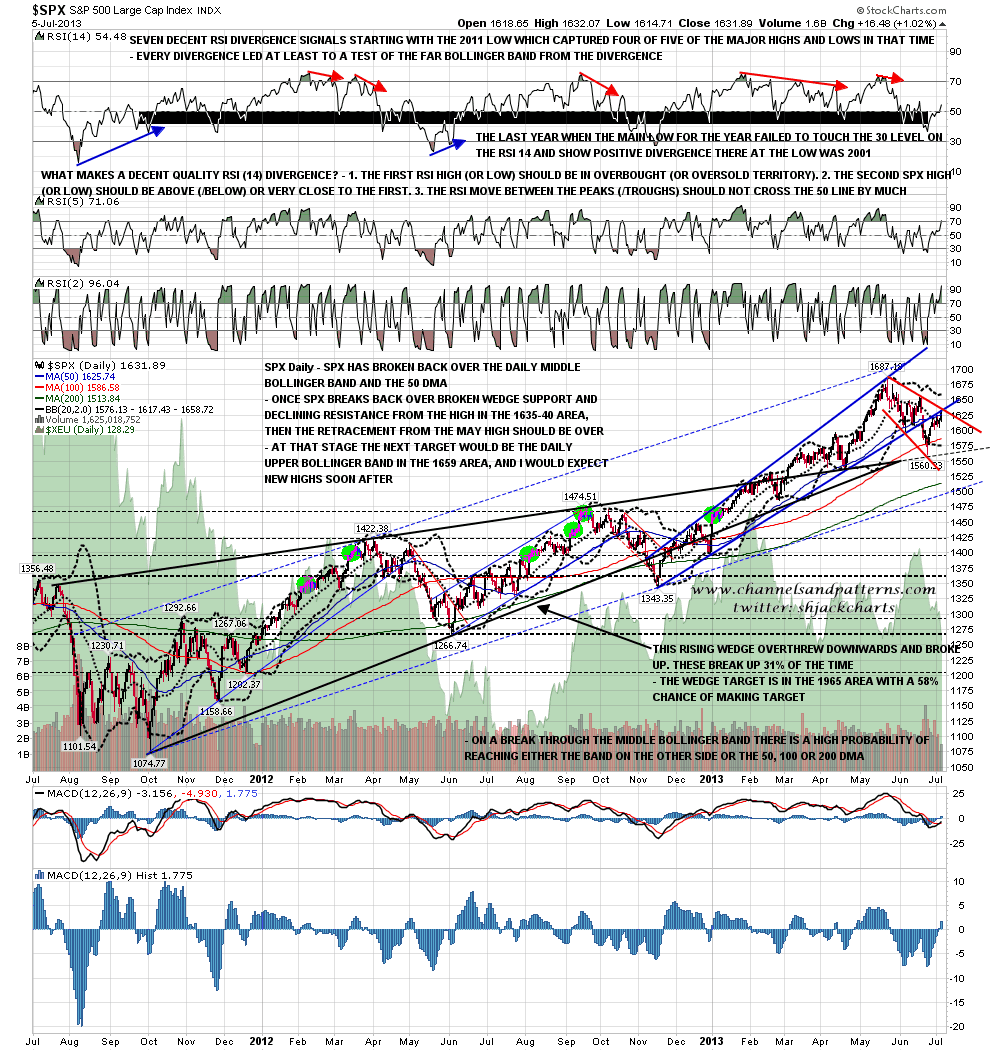
On the SPX 60 minute chart you can see the remaining significant resistance level in the 1635 area and that was double resistance yesterday as declining resistance from the high and broken wedge support crossed there. On a break over these the low for the retracement is very likely to be in.
Is this going to break up? Well the Russell 2000 (RUT), TRAN, WLSH and SPXEW have all already broken their declining resistance trendlines, and SPX, Dow, NYA and NDX are close. I’m thinking that they all probably break up here, but SPX, WLSH and NYA are the key ones to watch as they are the broadest based and only one of those has broken up so far. Four of those charts have clear broadening descending wedges indicating back to the highs. SPX 60min chart: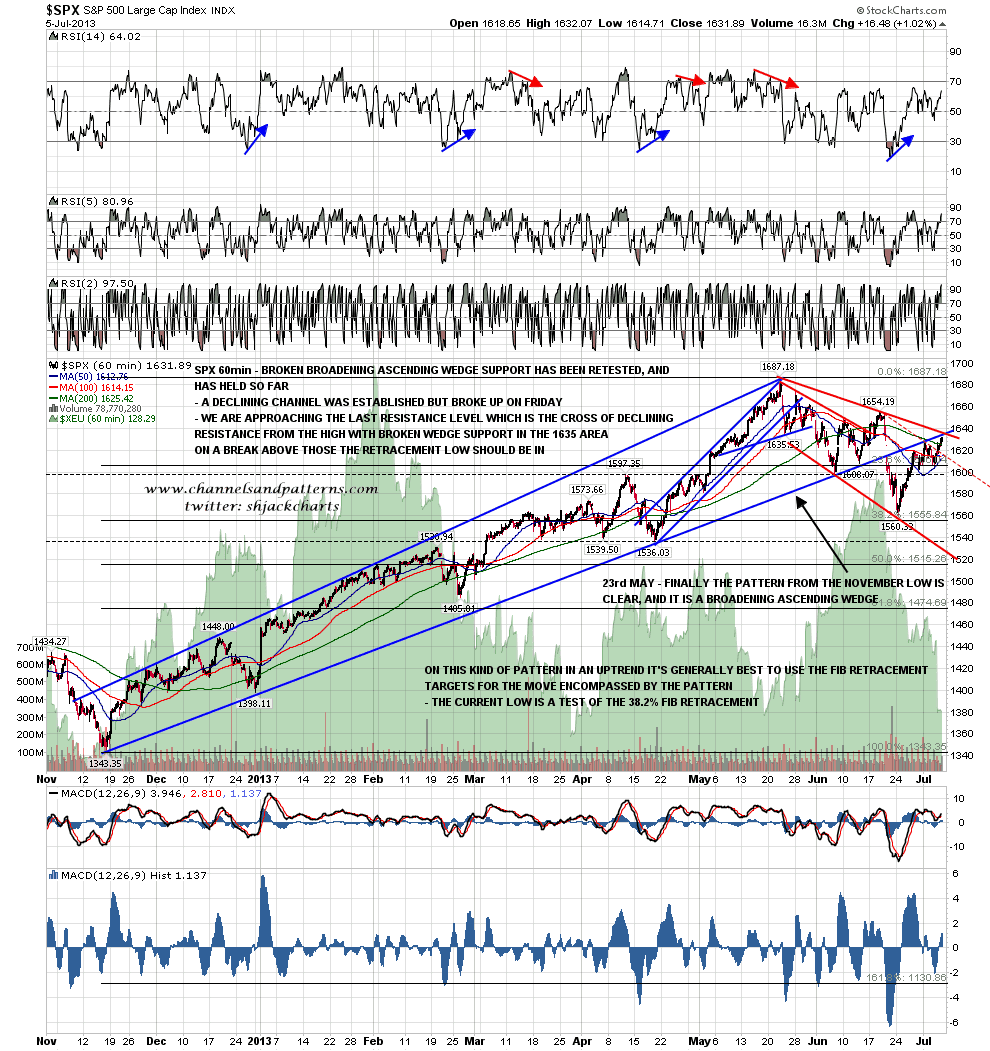
Here is the close up of the SPX 15min chart showing the resistance cross at 1635 and also the rising channel from the current retracement low. On a break over 1635 channel resistance is obviously in the 1657 area which is a good fit with the daily upper bollinger band. SPX 15min chart: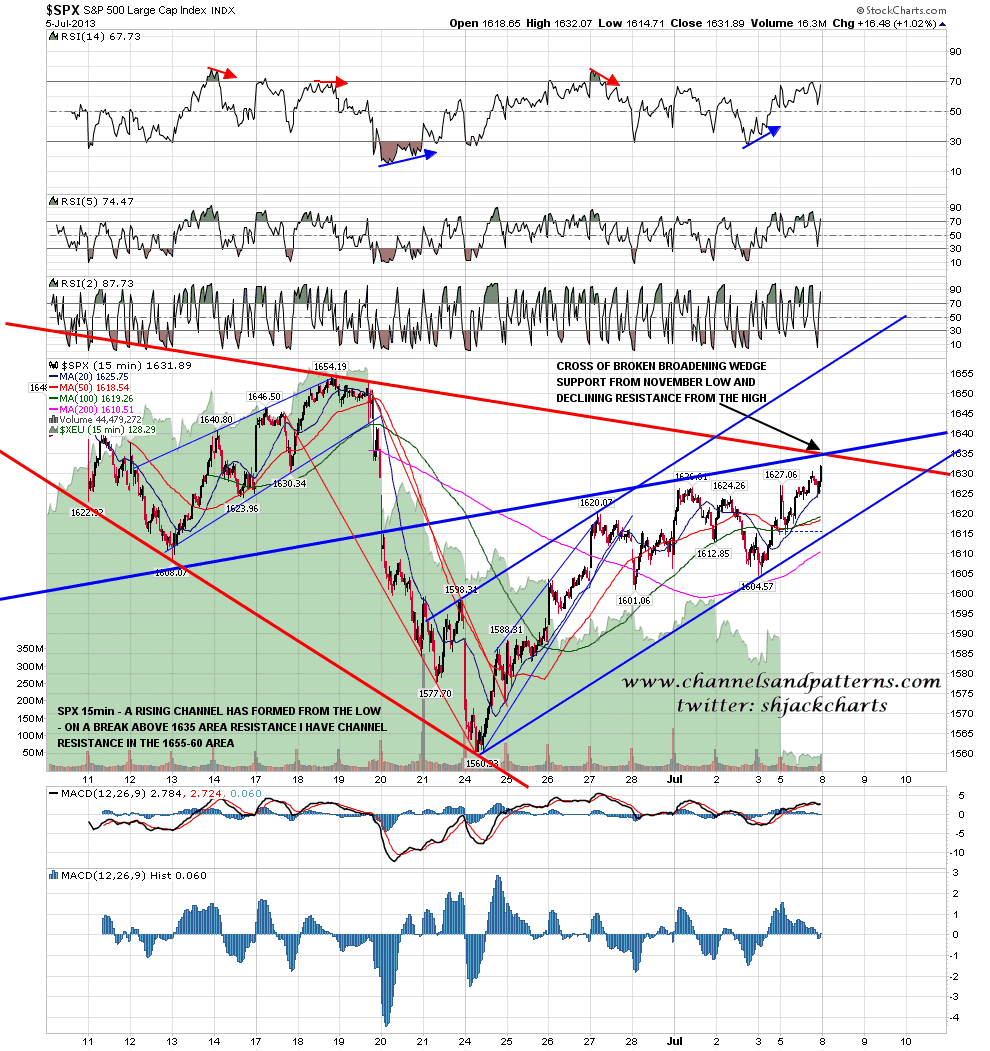
Another inflection point area reached on Friday was on the iShares Barclays 20+ Year Treasury Bond Fund (TLT), with a low at 106.17 below the 106.5 target I gave in my March projection. This support area covers the 105 to 106.5 area approximately so there is some scope to decline a bit further within the H&S scenario I gave then. As you can see, TLT has followed my March projection fairly well so far and if that continues then we would see a multi-month bounce starting shortly, to make a right shoulder before the next and larger decline begins. If strong support at 105/6 fails now then I have a wedge target in the 97 area. The TLT daily chart: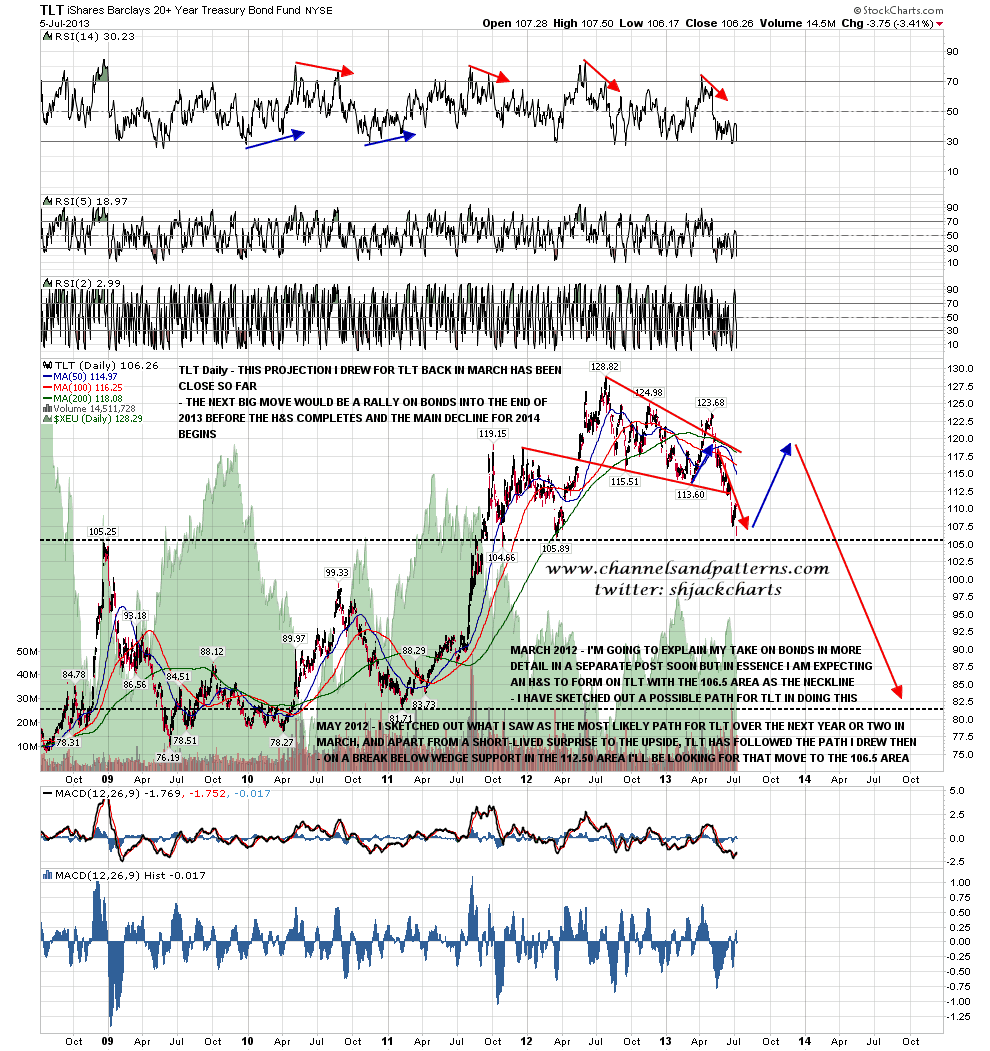
WTIC has also reached the major (triangle) resistance level I gave last week. This is a very major inflection point on oil as you can see from the chart, though as always I would warn that triangles are very prone to giving false breaks before the real break in the opposite direction. WTIC weekly chart: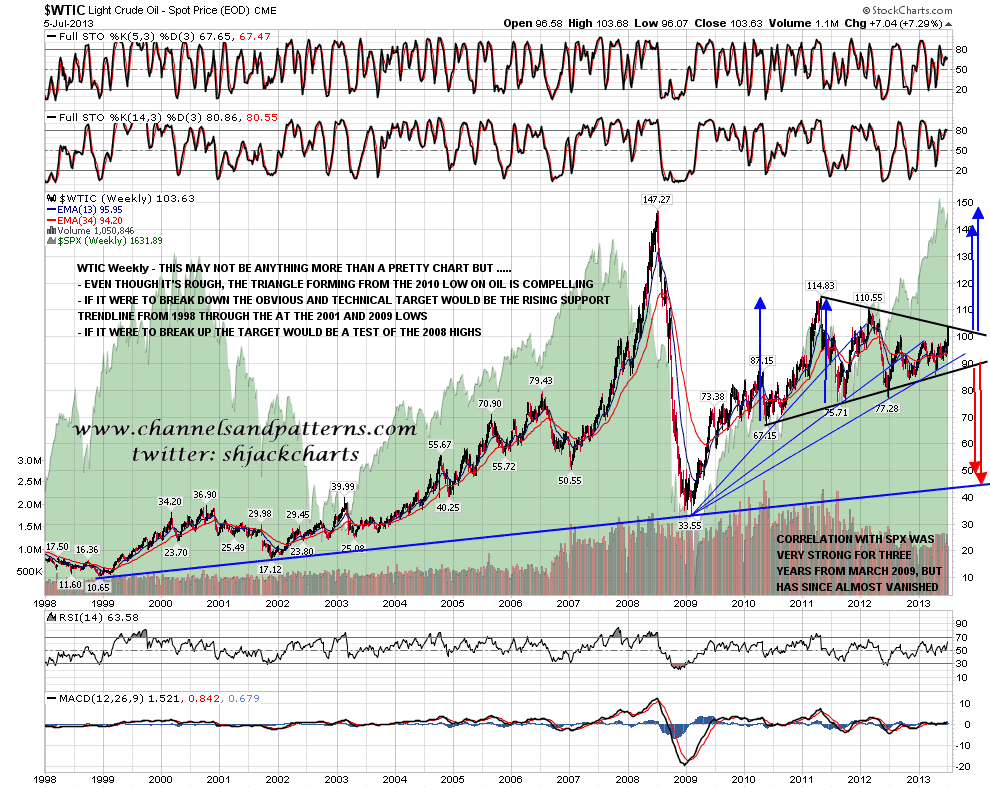
On the CL 60min chart CL is retracing on clear negative RSI divergence. This might just be a retracement but might equally be the start of a major reversal after the hit of major long term resistance on Friday. CL 60min chart: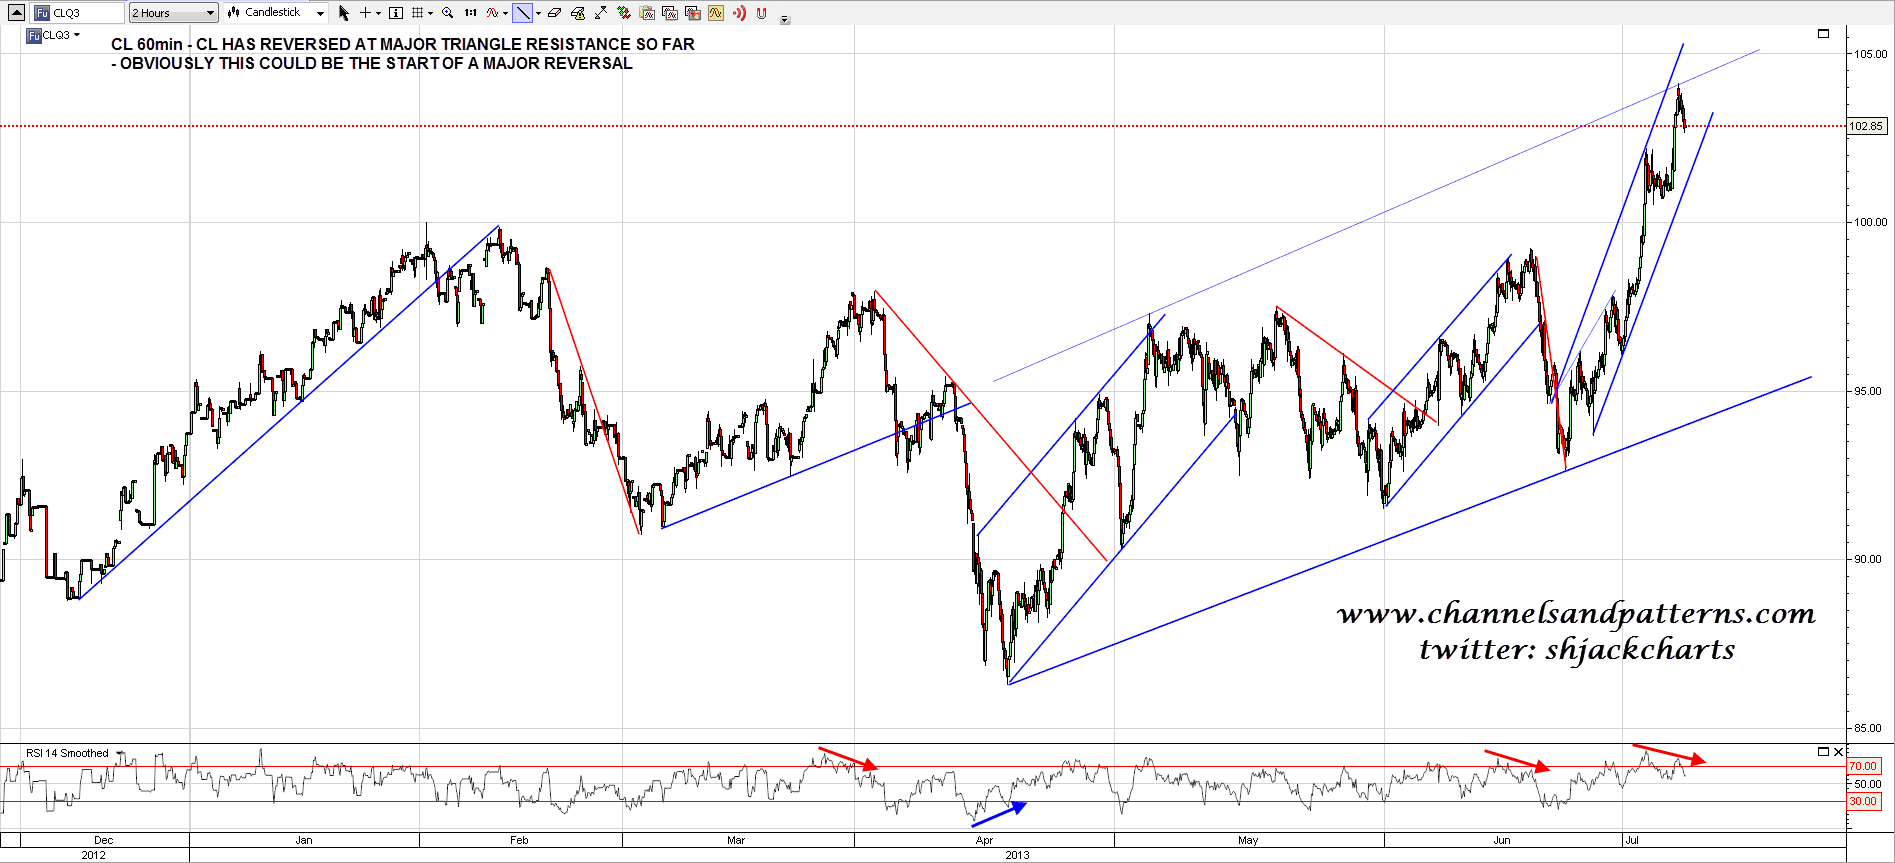
DX made new hits with some help from the ECB and Mark Carney at the BOE last week. I’m looking for follow through soon and on a break over 86 I’ll be looking for 88. DX is back on buy the dips here now. DX daily chart: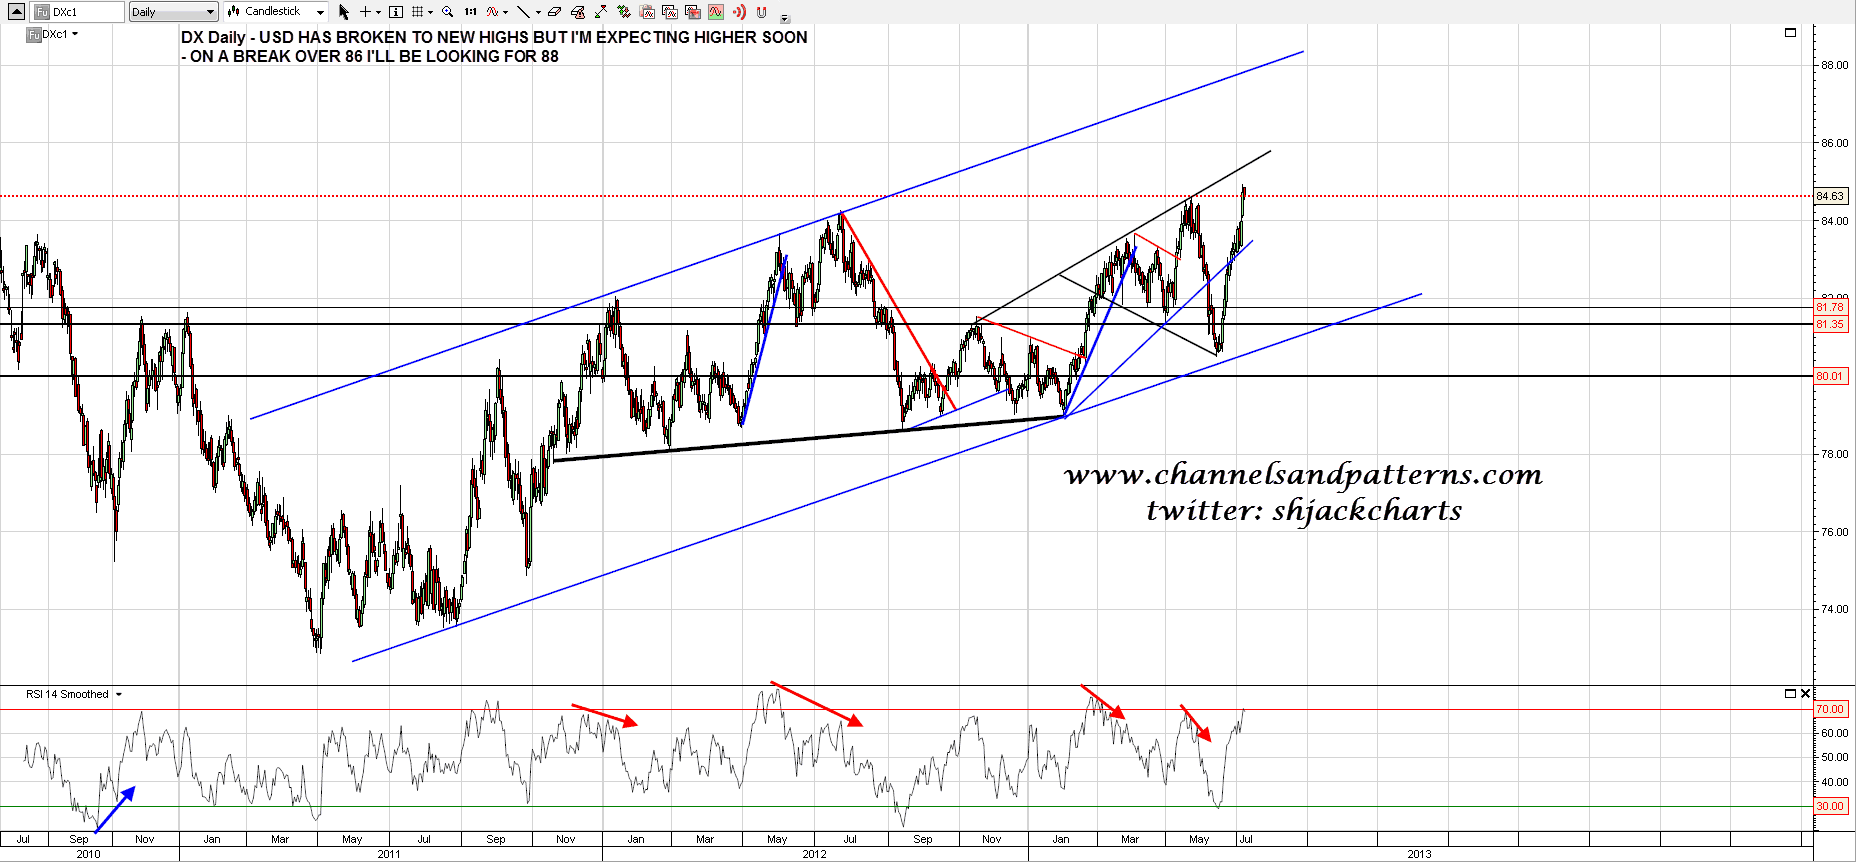
I’ve been reading that copper might reverse back up soon. Possibly. There is strong support at 3.00 which is holding so far and there is positive divergence on the weekly RSI. There are patterns in play with open targets in the 2.5 and 1.5 areas however so I’d be cautious about playing this one. I’m not giving a lot of weight to the 1.5 target as the H&S started too early in the uptrend for my liking, but I’ve still seen quite a few equivalent patterns make target so I’m not discounting it either. Copper weekly chart: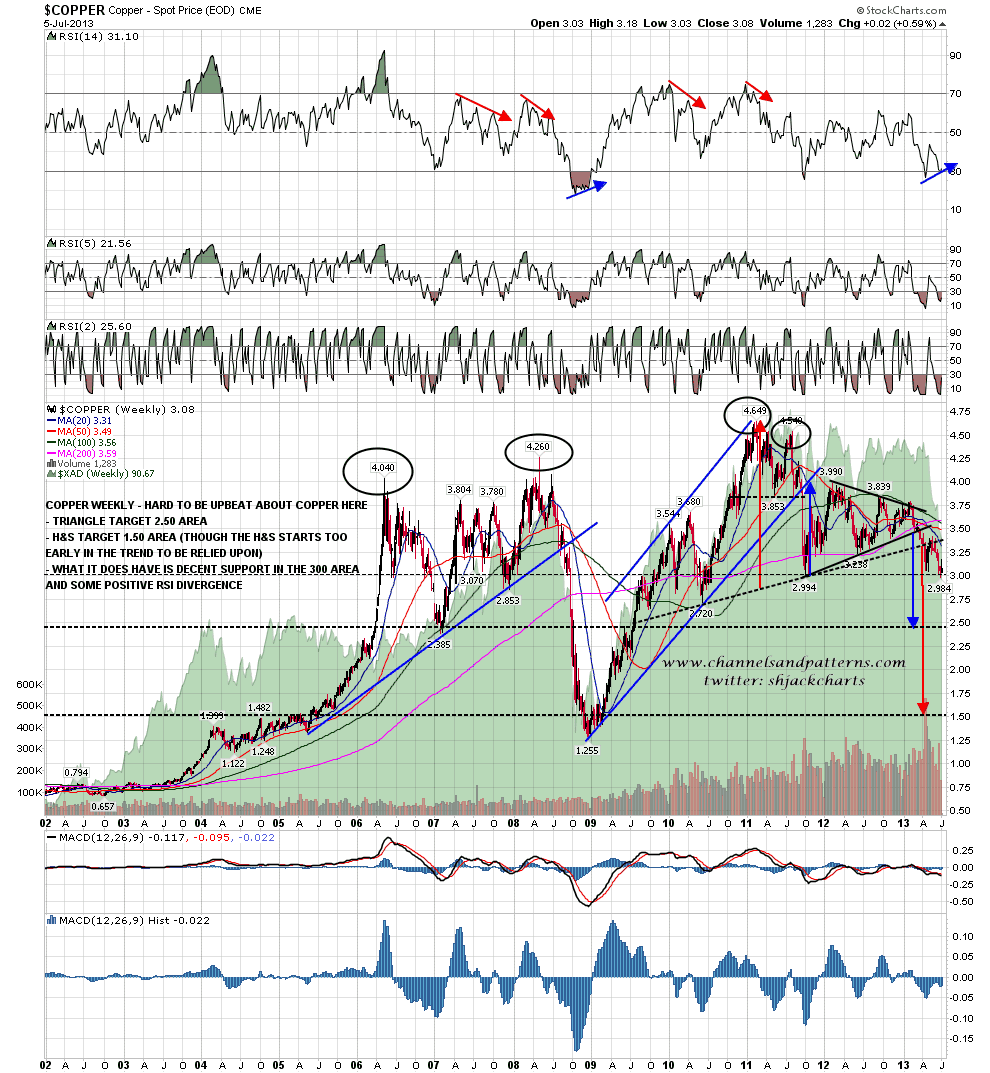
Two last comments: First I was asked over the weekend whether SPX could break up over declining resistance to retest the daily upper bollinger band, within the context of a larger decline to come. Technically yes, and I have an instance in 2005 where that happened (during a primary bull market) after a roughly equivalent decline, as part of a topping pattern.
In practical terms however, I’m doubtful. This setup will usually deliver new highs, and furthermore that topping setup would then have a target well below 1500, and I’m seeing 1500 as a level that is most unlikely to be broken before the next primary bear market. If we see a break over 1635 with any confidence today then I will be expecting to see new highs soon.
Secondly with ES at 1635.50 (roughly 1640 SPX) as I write we may well see a gap over the 1635 level at the open. A gap like that would look very bullish and that break should be respected.
- English (UK)
- English (India)
- English (Canada)
- English (Australia)
- English (South Africa)
- English (Philippines)
- English (Nigeria)
- Deutsch
- Español (España)
- Español (México)
- Français
- Italiano
- Nederlands
- Português (Portugal)
- Polski
- Português (Brasil)
- Русский
- Türkçe
- العربية
- Ελληνικά
- Svenska
- Suomi
- עברית
- 日本語
- 한국어
- 简体中文
- 繁體中文
- Bahasa Indonesia
- Bahasa Melayu
- ไทย
- Tiếng Việt
- हिंदी
Stock Market Inflection Points
Published 07/09/2013, 12:20 AM
Updated 07/09/2023, 06:31 AM
Stock Market Inflection Points
3rd party Ad. Not an offer or recommendation by Investing.com. See disclosure here or
remove ads
.
Latest comments
Install Our App
Risk Disclosure: Trading in financial instruments and/or cryptocurrencies involves high risks including the risk of losing some, or all, of your investment amount, and may not be suitable for all investors. Prices of cryptocurrencies are extremely volatile and may be affected by external factors such as financial, regulatory or political events. Trading on margin increases the financial risks.
Before deciding to trade in financial instrument or cryptocurrencies you should be fully informed of the risks and costs associated with trading the financial markets, carefully consider your investment objectives, level of experience, and risk appetite, and seek professional advice where needed.
Fusion Media would like to remind you that the data contained in this website is not necessarily real-time nor accurate. The data and prices on the website are not necessarily provided by any market or exchange, but may be provided by market makers, and so prices may not be accurate and may differ from the actual price at any given market, meaning prices are indicative and not appropriate for trading purposes. Fusion Media and any provider of the data contained in this website will not accept liability for any loss or damage as a result of your trading, or your reliance on the information contained within this website.
It is prohibited to use, store, reproduce, display, modify, transmit or distribute the data contained in this website without the explicit prior written permission of Fusion Media and/or the data provider. All intellectual property rights are reserved by the providers and/or the exchange providing the data contained in this website.
Fusion Media may be compensated by the advertisers that appear on the website, based on your interaction with the advertisements or advertisers.
© 2007-2024 - Fusion Media Limited. All Rights Reserved.