Everyone blew out in October…
The difficult October for active managers continues to be the talk of the industry. Most risk managers blinked in the face of rising volatility and now they are really behind their benchmarks. Some are chasing risk investments trying to tack on any performance they can before year end. Some notable hedge funds have even decided this month to close their funds and return capital to investors. Active managers will have a tough time talking their way out of this recent dip given that the fully invested ETFs bounced right back while their performance did not. One way that active managers could add value was to find the rotations happening under the hood of the markets as they returned to all-time highs. Consumer and Industrial stocks have joined Technology names in leading the markets while Energy stocks continue to see outflows and lower prices. Overseas, Brazil continues to be a banana peel and Europe has too many issues to comfort investors.
@RyanDetrick: Incredibly, $SPX hasn’t been down 4 days in a row in ’14. Since ’50, no year has ever gone a full calendar year without this happening. $SPY
As the S&P 500 stretched to all-time new highs last week, Technology was joined by Consumer Cyclicals in the front seat…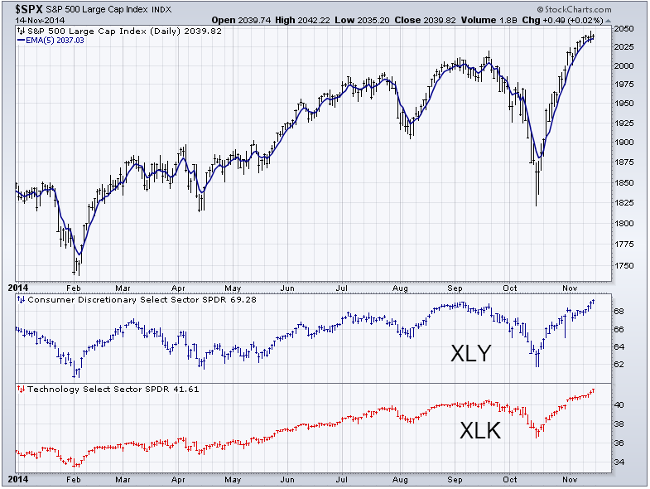
Last week Energy continued to disappoint investors as Crude Oil traded to prices not seen since 2009. Also interesting was that after just hitting new highs, Utilities retreated strongly. Are investors looking for more risk in U.S. equities by taking profits in the Utes?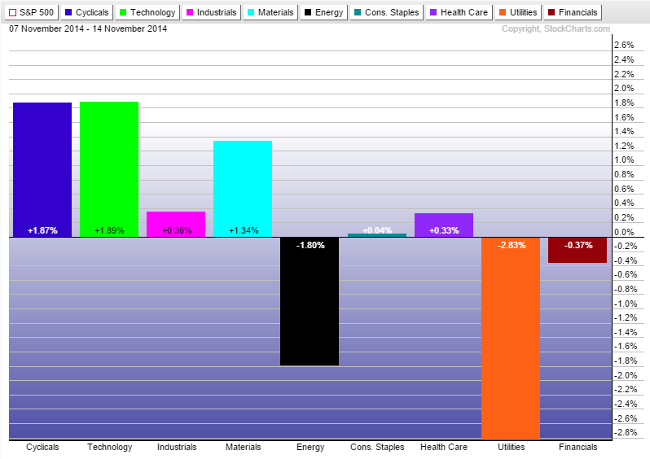
More broadly, Brazil, Oil & Energy were joined in their losses while Apple pulled Tech and the Nasdaq 100 to a winning week…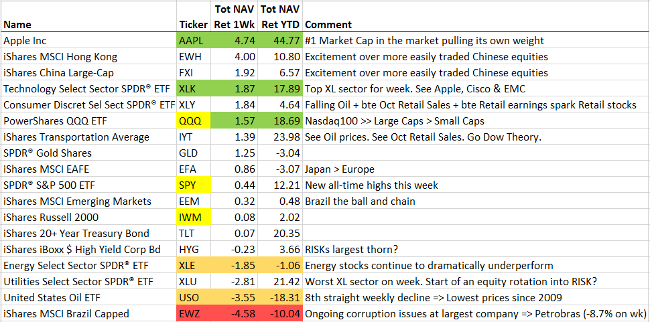
Among the week’s Economic data, the number of people quitting their jobs hit 6 year highs while the number of job openings hit 13 year highs…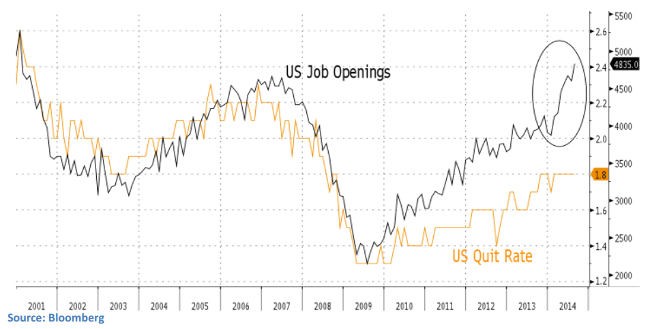
The U.S. labor market continues to show signals of ongoing improvement. The Job Openings index has accelerated since February and the last reading (for August) hit a new high. Similarly, the quit rate has increased slowly over the past few years, although remains below levels from the prior cycle. A higher quit rate can be indicative of higher confidence in the labor market, as employees could be more willing to quit a job they are not satisfied with if they have the confidence a new job could be easily found.
(StevenPytlar/PrimeExecutions)
Equally important to the strength in the U.S. job market is the benefit to consumers from plunging energy costs…
- @DavidSchawel: Barclays: A 20% decline in gas prices would result in a $40b reduction in energy CapEx but $70b in consumer saving
- A recent report from Bank of America Merrill Lynch said that households with an annual income below $50,000 spent an average of 21% of their earnings on energy costs, from home heating oil to filling their gas tanks. For these households, the proportion of their income going to energy is three times as high as it is for households with an income above $50,000. The analysts calculate that energy costs now account for double the percentage of these families’ budgets than they did in 2001. Nationally, gasoline prices have fallen below $3 per gallon for the first time since 2010. We haven’t been able to fill our tanks this inexpensively in more than 1,400 days. With nearly half of all American families seeing one fifth of their spending go to oil, gas, and gasoline, a sustained drop in prices means an immediate and significant stimulus. While it may not be a big enough stimulus to make up for the overall condition in which these low-income earners find themselves, it will be welcome nonetheless
The markets saw a preview last week in the retail sales data. Less spent at the pump means more to spend elsewhere…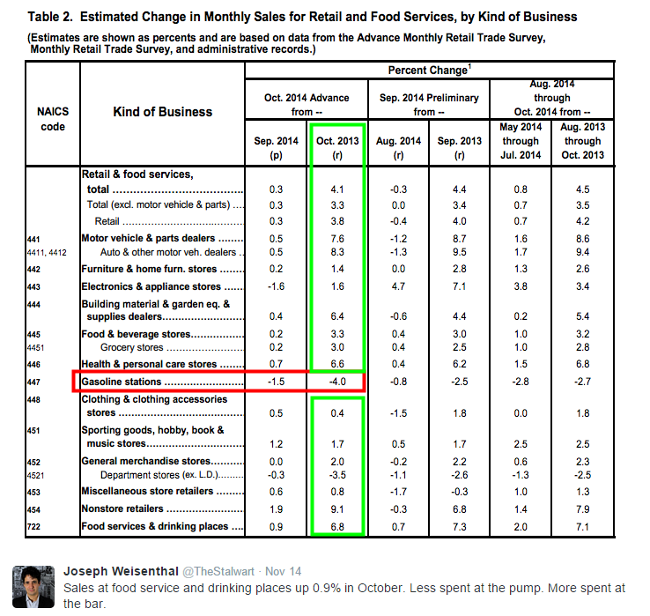
And finally, falling Oil prices are starting to lift Consumer Retail stocks…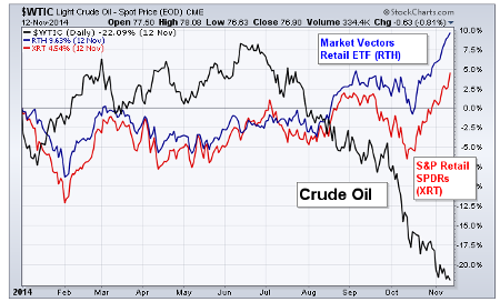
Of course lower Oil continues to lend a hand to Transportation stocks… which seems to finally be helping the Industrials…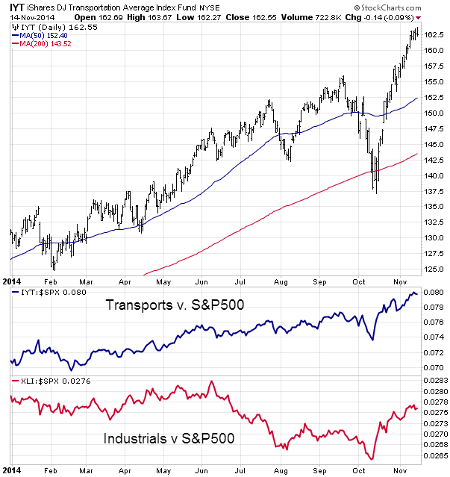
Falling Oil & Gas prices have played havoc with the credit spreads for Energy companies…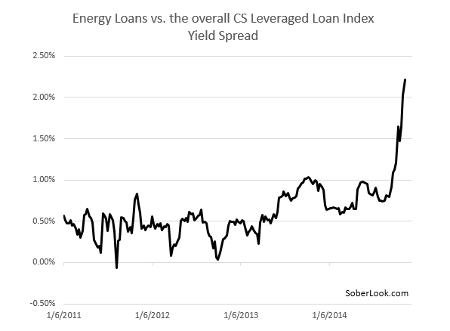
…Which is helping to keep pressure on Junk Bond performance. This remains a major thorn in the current market. In 2012-2013, the performance of Credit helped Equities. That help is no longer here…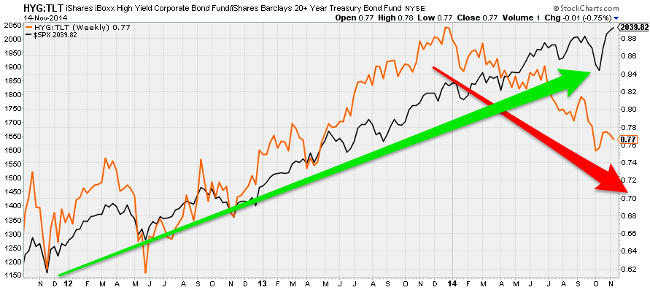
This is more evident in the lowest rated Junk Bond prices…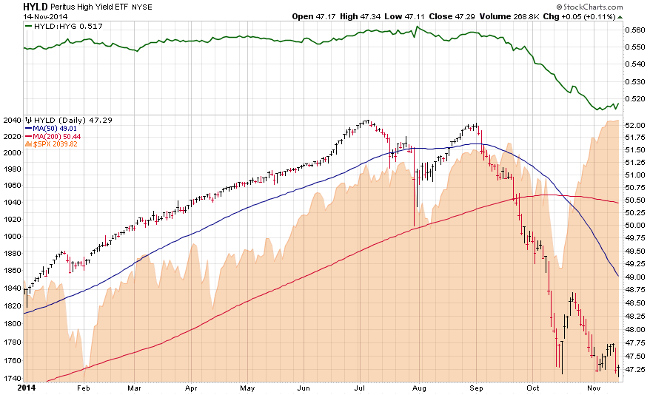
The U.S. wasn’t the only geography to post much better than expected earnings as Europe also had a great Q3 reporting period…
Eurozone earnings have registered the highest rate of positive surprise since Q1 2011, which is right before the ECB raised interest rates and the debt crisis began in earnest. The improvement in earnings surprises could signal that investor sentiment has hit a low and that much of the negative trends have been discounted, allowing for a greater chance of positive surprise.
(StevenPytlar/PrimeExecutions)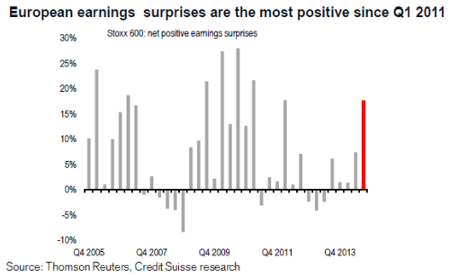
Add Drought to the list of Brazilian worries…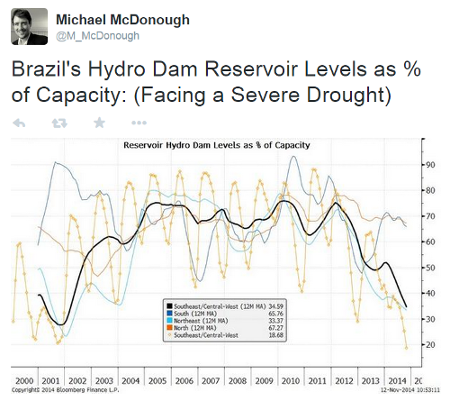
Back to the U.S., here is a great long perspective chart of the S&P 500. Is the market done with the 2000 plateau?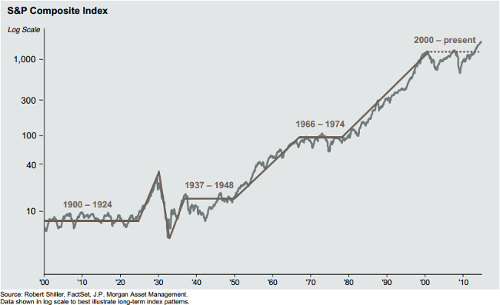
World Leader Quote of the Week…
“I guess I’ll shake your hand but I have only one thing to say to you: you need to get out of Ukraine”, Canadian PM Stephen Harper told Russian President Vladimir Putin.
Most interesting Re-Tweet of the Week (Mr. Noto was previously the CFO of the NFL from 2008-2010)…
Meanwhile, Saturday Night Live came up with their own solution to the NFL’s concussion problems…
Finally, it was a really good week for Space Geeks. First a great movie and then a great mission…
The information presented here is for informational purposes only, and this document is not to be construed as an offer to sell, or the solicitation of an offer to buy, securities. Some investments are not suitable for all investors, and there can be no assurance that any investment strategy will be successful. The hyperlinks included in this message provide direct access to other Internet resources, including Web sites. While we believe this information to be from reliable sources, 361 Capital is not responsible for the accuracy or content of information contained in these sites. Although we make every effort to ensure these links are accurate, up to date and relevant, we cannot take responsibility for pages maintained by external providers. The views expressed by these external providers on their own Web pages or on external sites they link to are not necessarily those of 361 Capital.
