
Stifel Financial Corp. (NYSE:SF) reported a positive earnings surprise of around 17% for third-quarter 2016. Adjusted earning per share of 69 cents outpaced the Zacks Consensus Estimate of 59 cents.
Results benefited from an improved top line, partially offset by higher expenses.
On a GAAP basis, Stifel Financial recorded earnings per share of 21 cents, down 4.5% year over year. Net income available to common shareholders was $16.3 million, down 5.2% from the year-ago quarter. It must be noted that these GAAP figures were impacted by certain non-recurring charges.
Revenues & Expenses Rise
Net revenues were $642 million, up 8.5% year over year. The upside was primarily due to higher Global Wealth Management and Institutional Group segments’ net revenues, which increased 9.2% and 11.5%, respectively, on a year-over-year basis. Moreover, the revenue figure outperformed the Zacks Consensus Estimate of $626 million.
The rise in net revenue was partially mitigated by a negative $6.8 million other revenues, compared to $2.1 million net revenue in the prior-year quarter.
Non-interest expenses were $614 million, up 7.9% from the year-ago quarter. The mounting non-interest operating expenses are a result of a rise in most categories of expenses except expenses on communication and office supplies, and commissions and floor brokerage.
Credit Quality: A Mixed Bag
Allowance, as a percentage of loans, decreased to 0.76% from 1.13% in the prior-year quarter. However, non-performing assets as a percentage of total assets inched up to 0.28% from 0.03% in the year-ago quarter.
Strong Capital Position
Stifel Financial’s capital position remained strong during the quarter. As of Sep 30, 2016, total assets surged 84% to $17.2 billion from $9.4 billion as of Sep 30, 2015. Book value came in at $40.65 per share, up 11% from the prior-year quarter, based on 66.2 million of common shares outstanding. Stockholders’ equity increased 8% year over year to $2.7 billion.
As of Sep 30, 2016, the company’s Tier 1 leverage capital ratio was 11.8% compared to 16.4% as of Sep 30, 2015. Further, Tier 1 risk-based capital ratio was 22% compared to 29.4% for the same time period.
Our Viewpoint
Stifel Financial, with its solid business model and strategic acquisitions, is well poised for growth. While the company’s sound capital position and robust top-line performance will boost results over the long haul, regulatory issues and the low interest rate environment raise concern.
STIFEL FINL Price, Consensus and EPS Surprise
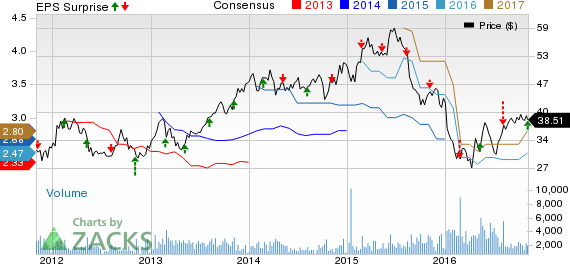
STIFEL FINL Price, Consensus and EPS Surprise | STIFEL FINL Quote
Stifel Financial sports a Zacks Rank #1 (Strong Buy). You can see the complete list of today’s Zacks #1 Rank stocks here.
Competitive Landscape
The Charles Schwab Corporation (NYSE:SCHW) third-quarter 2016 adjusted earnings of 34 cents per share outpaced the Zacks Consensus Estimate by a penny. Results excluded litigation proceeds of nearly $14 million, related to the company’s non-agency residential mortgage-backed securities portfolio.
Revenue growth, primarily driven by increase in equity market volatility, lower level of fee waivers and stable provisions acted as tailwinds. Also, there was a significant rise in total client assets and new brokerage accounts. However, higher expenses remained a concern.
TD Ameritrade Holding Corporation’s (NASDAQ:AMTD) reported its fourth-quarter fiscal 2016 (ending Sep 30) earnings of 35 cents per share, lagging the Zacks Consensus Estimate of 38 cents. Also, the reported figure was down 12.5% from the prior-year quarter.
Net revenue was down primarily due to a fall in commissions and transaction fees. Also, higher expenses and continued decline in net interest margin (NIM) added to the downside. Further, the company recorded a decline in average client trades per day while the total client asset balances witnessed improvement.
Interactive Brokers Group, Inc. (NASDAQ:IBKR) reported adjusted earnings per share of 30 cents, lagging the Zacks Consensus Estimate by 2 cents. Moreover, earnings compared unfavorably with the prior-year quarter tally of 35 cents.
Decline in revenues, increased expenses and dismal performance of the Market Making segment led to the unfavorable result. However, on the upside, the company experienced notable increase in net interest income, gain on currency diversification strategy and growth in customer equity.
Confidential from Zacks
Beyond this Analyst Blog, would you like to see Zacks' best recommendations that are not available to the public? Our Executive VP, Steve Reitmeister, knows when key trades are about to be triggered and which of our experts has the hottest hand. Click to see them now>>
SCHWAB(CHAS) (SCHW): Free Stock Analysis Report
INTERACTIVE BRK (IBKR): Free Stock Analysis Report
TD AMERITRADE (AMTD): Free Stock Analysis Report
STIFEL FINL (SF): Free Stock Analysis Report
Original post
Zacks Investment Research