Star Bulk Carriers Corp (NASDAQ:SBLK)
Star Bulk Carriers Corp. (SBLK), a global shipping company yesterday reported their third quarter 2016 financial results. Star Bulk reported third quarter adjusted earnings of a loss of $0.44 per share which beat analyst expectations of a loss of $0.65 per share. Star Bulk reported third quarter revenues of $59.9 million which beat analyst expectations of $42.8 million.
Star Bulk Carriers Corp. CEO’s Comments
“We released today our Q3 and nine months 2016 financial results. Total revenues for the quarter were at $60 million, corresponding to an average daily TCE per vessel of $7,558. Our average daily OPEX per vessel for Q3 2016 was $3,784, reduced by 15.6% y-o-y. Our average daily G&A expenses and management fees for Q3 2016, net for non-cash items, were at $1,047 per vessel. Adjusted EBITDA was $11.9 million, increased by 94% y-o-y, as our cost and process optimization initiatives continue to bear fruit.
As previously announced, during the third quarter of 2016 we have agreed the restructuring of our debt facilities, pushing debt repayments of approximately $224 million until after June 30, 2018 and raising $51.5 million of new equity, with our significant shareholders providing approximately 65% of that. We would like to thank our lenders as well as our shareholders for their continuous support.” Market Wired
SBLK Technical Analysis
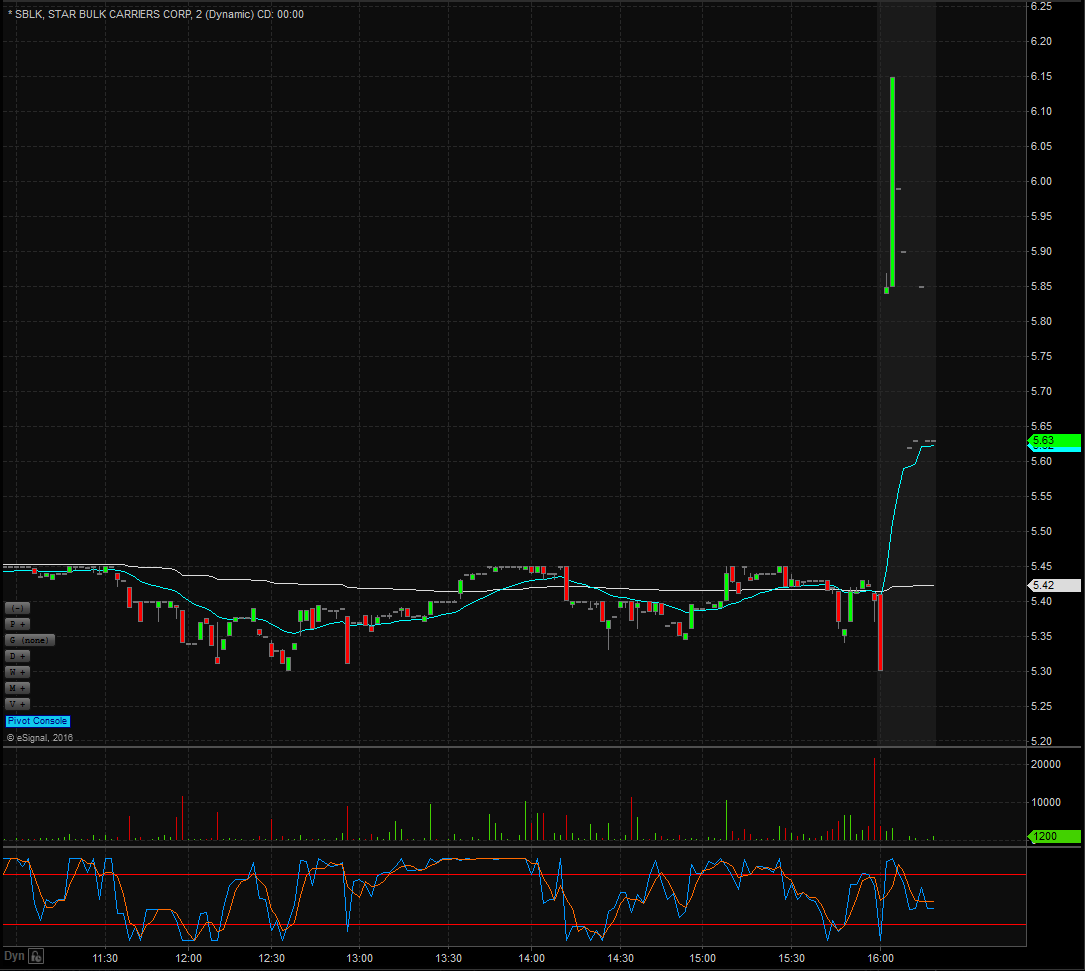
SBLK opened trading yesterday at $5.50 which was up from the previous day’s trading close of $5.40. SBLK closed trading yesterday at $5.41 and spiked up after market to $5.89, equivalent to a 9% increase from the closing price. Taking a look at the daily chart we can see that the last time SBLK traded above these levels we have to go back to the week of November 17th, 2015 when it traded $6.10. Taking a closer look at the daily chart we can see that before the spike up SBLK had already been in an overall upward trend dating back to November 4th when it traded at $4.08. SBLK has a float of 14.02 million shares and traded 1.39 times the normal daily trading volume on Monday. For trading purposes, I would like to see SBLK open trading on Tuesday above $5.73 and if it does I would be looking to take a long position at the bell. My stop loss would be $0.10 from my entry position fearing anything more than that and the stock would start to fill in the gap up.
Company Profile
Star Bulk Carriers Corp., a shipping company, provides seaborne transportation solutions in the dry bulk sector worldwide. Its vessels transport various bulks, which include iron ore, coal, and grain, as well as bauxite, fertilizers, and steel products. As of February 1, 2016, the company’s fleet included 70 operating vessels and 19 newbuilding vessels under construction at shipyards in Japan and China, as well as 1 chartered-in Supramax vessel. It also provides vessel management services to dry bulk vessels. Star Bulk Carriers Corp. is based in Athens, Greece.

