
Stanley Black & Decker Inc. (NYSE:SWK) has reported better-than-expected earnings results for the fourth quarter of 2019, with a beat of 0.9%. This marks the company’s fourth consecutive quarter of impressive results. However, the quarter’s sales lagged estimates by 0.7%.
Earnings, excluding acquisition-related charges and other one-time impacts, were $2.18 per share in the quarter, surpassing the Zacks Consensus Estimate of $2.16. Also, earnings grew 3.3% from the year-ago quarter’s $2.11 per share, driven by sales growth and lower taxes.
For 2019, the company’s earnings (excluding acquisition-related charges and other one-time impacts) were $8.40 per share, increasing 3.1% from the previous year. Also, the bottom line surpassed the Zacks Consensus Estimate of $8.39. External headwinds in the year totaled $445 million.
Segmental Revenues
In the quarter under review, the company’s net sales were $3,714.2 million, reflecting 2.2% year-over-year growth. The improvement was primarily driven by 1% rise in volume, 1% impact of positive price and 1% gain from acquired assets/divestitures. These were partially offset by 1% adverse impact of unfavorable movements in foreign currencies.
However, the company’s top line lagged the Zacks Consensus Estimate of $3,777 million.
Stanley Black reports revenues under three segments. A brief discussion on the quarterly results is provided below:
Tools & Storage’s revenues totaled $2,609.8 million, representing 70.3% of net revenues in the quarter under review. On a year-over-year basis, the segment’s revenues grew 1.1% on 2% gain from volume growth, partially offset by 1% adverse impact of currency movements.
The Industrial segment generated revenues of $597.1 million, accounting for 16.1% of net revenues in the reported quarter. Sales grew 8.9% year over year, primarily driven by 13% gain from acquired assets, partially offset by 4% negative impact of volume decline.
The Security segment’s revenues, representing 13.6% of net revenues, grew 0.7% year over year to $507.3 million. Gains of 2% from volume growth and 2% from favorable pricing actions were offset by 1% adverse impact of foreign-currency woes and 2% from divestitures.
For 2019, the company’s net sales were $14,442.2 million, increasing 3.3% year over year. However, the top line lagged the Zacks Consensus Estimate of $14.5 billion.
Margin Profile
In the reported quarter, Stanley Black’s cost of sales rose 4.7% year over year to $2,536.3 million. It represented 68.3% of the quarter’s net sales versus 66.7% in the year-ago quarter. Gross margin slipped 160 basis points (bps) to 31.7% due to adverse impacts of external headwinds as well as woes related to plant absorption and product mix in Tools & Storage. This was partially offset by the positive impact of volume growth, favorable pricing and improved productivity.
Selling, general and administrative expenses declined 8% year over year to $671.1 million. It represented 18.1% of net sales in the reported quarter versus 20.1% in the year-ago quarter. Operating profits grew 5% year over year to $506.8 million, while margin expanded 30 bps to 13.6%.
Adjusted tax rate in the reported quarter was 15.8% compared with the year-ago quarter figure of 17.3%.
Balance Sheet & Cash Flow
Exiting the fourth quarter of 2019, Stanley Black had cash and cash equivalents of $297.7 million, down 4.5% from $311.7 million recorded in the last reported quarter. Long-term debt (net of current portions) was down 18.7% sequentially to $3,176.4 million.
During the quarter, the company repaid long-term debt of $750 million.
In the fourth quarter, it generated net cash of $1,243.3 million from operating activities, 1.8% higher than $1,220.8 million generated in the year-ago quarter. Capital spending totaled $141.2 million versus $164.7 million in the year-ago quarter. Free cash flow in the quarter was $1,102.1 million, up 4.4% year over year.
During the reported quarter, Stanley Black paid out cash dividends of $104.4 million, while spent $15.6 million for purchasing treasury stocks.
Important Events
Concurrent with the earnings release, the company has announced that it signed an agreement to acquire Consolidated Aerospace Manufacturing, LLC. The transaction has been valued at $1.5 billion.
The buyout is anticipated to strengthen Stanley Black’s engineered fastening business within the Industrial segment. Further, this will likely enhance growth opportunities in the aerospace and defense market.
The completion of the buyout is subject to the fulfillment of customary closing conditions. The transaction will be funded through borrowing and cash. Upon completion, the buyout is anticipated to boost Stanley Black’s earnings by 30-40 cents per share by the third year.
Additionally, the company announced a leadership transition for Tools & Storage.
Outlook
In the quarters ahead, Stanley Black anticipates gaining from a growing recognition of its brands, especially Craftsman. Further, revenue synergies, innovation and favorable e-commerce trends will likely be beneficial. Also, margin expansion through benefits from cost-reduction initiatives will likely help.
The company anticipates gaining from the cost-reduction initiatives that it took in 2019. Also, it is progressing well with its multi-year initiatives, which is aimed at margin expansion. The company believes that the Security segment is poised for growth in organic sales and margins in 2020 and going forward.
For 2020, the company anticipates adjusted earnings of $8.80-$9.00 per share, suggesting an increase of 5-7% from the year-ago reported figure. The cost-saving program of 2019 will likely contribute 95 cents per share to earnings, while organic growth will probably add 40-50 cents. Currency and tariff headwinds are likely to adversely impact earnings by 60-70 cents, while financing costs, tax rate and others will likely affect the same by 25 cents.
Organic growth will likely be 3%. Free cash flow conversion is predicted to be 90-100%.
Stanley Black & Decker, Inc. Price, Consensus and EPS Surprise
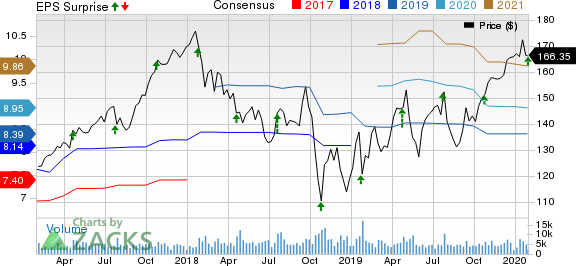
Stanley Black & Decker, Inc. price-consensus-eps-surprise-chart | Stanley Black & Decker, Inc. Quote
Zacks Rank & Stocks to Consider
With a market capitalization of $24.7 billion, Stanley Black currently carries a Zacks Rank #3 (Hold).
Some better-ranked stocks in the Zacks Industrial Products sector are SPX FLOW, Inc. (NYSE:FLOW) , Barnes Group, Inc. (NYSE:B) and Tennant Company (NYSE:TNC) . While SPX FLOW currently sports a Zacks Rank #1 (Strong Buy), Barnes and Tennant carry a Zacks Rank #2 (Buy). You can see the complete list of today’s Zacks #1 Rank stocks here.
In the past 60 days, earnings estimates for these companies have improved for the current year. Further, earnings surprise for the last four quarters, on average, was positive 6.95% for SPX FLOW, 4.21% for Barnes and 28.65% for Tennant.
Looking for Stocks with Skyrocketing Upside?
Zacks has just released a Special Report on the booming investment opportunities of legal marijuana.
Ignited by new referendums and legislation, this industry is expected to blast from an already robust $6.7 billion to $20.2 billion in 2021. Early investors stand to make a killing, but you have to be ready to act and know just where to look.
See the pot trades we're targeting>>
SPX FLOW, Inc. (FLOW): Free Stock Analysis Report
Stanley Black & Decker, Inc. (SWK): Free Stock Analysis Report
Tennant Company (TNC): Free Stock Analysis Report
Barnes Group, Inc. (B): Free Stock Analysis Report
Original post
Zacks Investment Research