Heading into the holiday shortened week, last week’s review of the macro market indicators suggested, that the Equity markets looked tired in their bounce. We Looked for Gold (GLD) to consolidate or bounce in its downtrend. Crude Oil (USO) was biased higher in the consolidation. The US Dollar Index (UUP) looked strong and ready to continue higher, while U.S. Treasuries (TLT) might continue their bounce in the downtrend. The Shanghai Composite (SSEC) and Emerging Markets (EEM) both looked to bounce in their downtrends. Volatility (VIX) looked to remain subdued, but drifting higher keeping the bias lower for the equity index ETF’s SPY, IWM and QQQ. Their charts all looked to be tired in the upward move within their intermediate downtrends, in the long term uptrend.
There were plenty of fireworks outside and in the market. Gold played out a dead cat bounce while Crude Oil broke out to the upside. The U.S. Dollar continued higher , while Treasuries bounced before plummeting Friday. The Shanghai Composite continued to consolidate in a tight range at the recent lows while Emerging Markets met resistance and moved back lower. Volatility drifted sideways before a selloff Friday. The Equity Index ETF’s, SPY and IWM tested the recent highs in the range with the QQQ moving higher. What does this mean for the coming week? Let’s look at some charts.
SPY Daily, SPY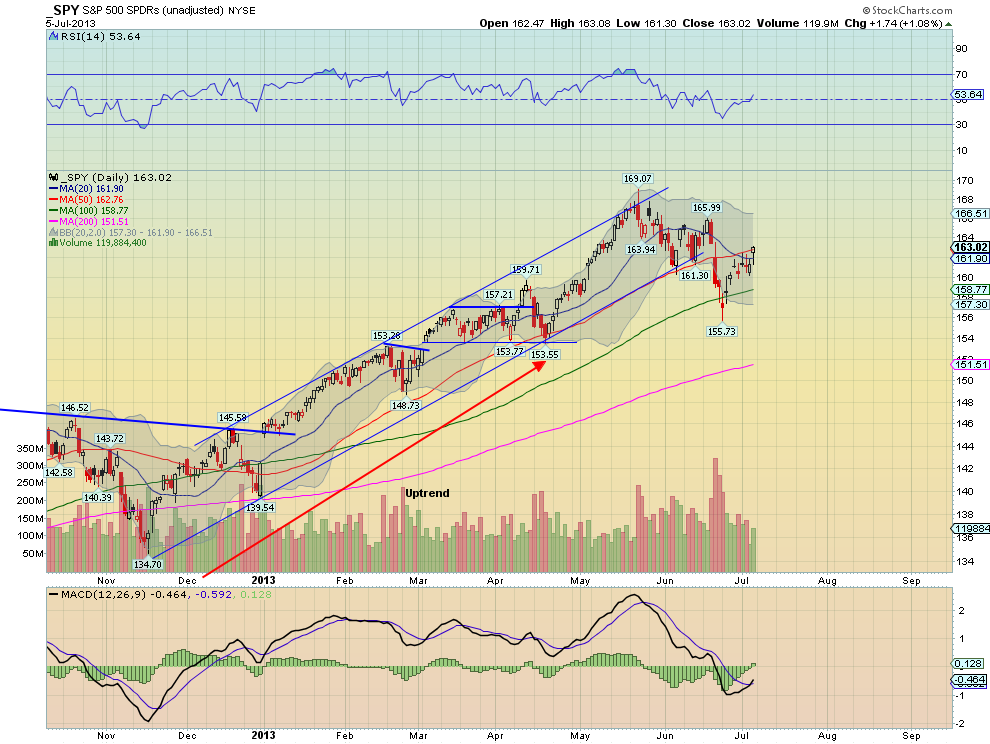
SPY Weekly, SPY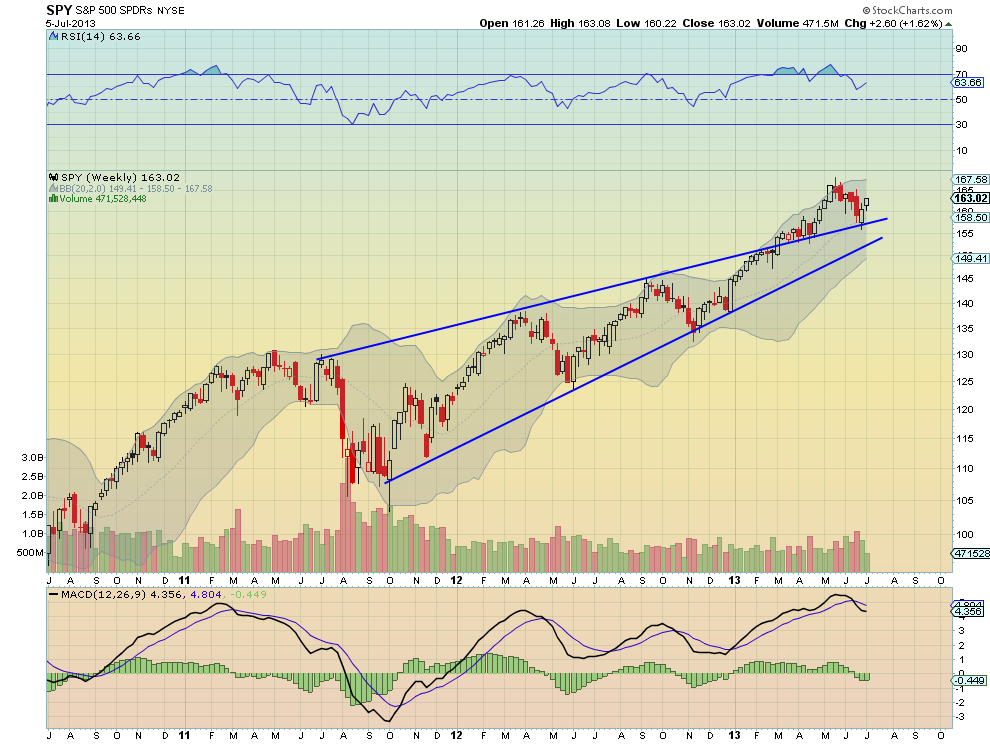
The SPY printed a series of rising small body and doji candles under the 20 and 50 day Simple Moving Averages (SMA) before surging higher to close above both on Friday. The Hanging Man candle still raises caution, as it can be a reversal candle if confirmed lower on Monday. The Relative Strength Index (RSI) on the daily chart is rising back through the mid line, and never touched in bearish territory. The Moving Average Convergence Divergence indicator (MACD) turnied higher and crossed up. These support more upward price action. The weekly picture is also leaning to the upside. The continued rise off of the retest of the wedge breakout comes with a RSI that is moving back higher and in bullish territory, and a MACD that is leveling after a small pullback. There is resistance higher at 166 and 168 before 169.07, the all-time high. Support lower comes at 161.60 and 159.70 before 157.10. A move under 157.10 looks very bearish, and a failure to move over 166 is bearish as well. Upward Price Action in the Intermediate Downtrend in the Long Term Uptrend.
Heading into the first full week of July sees the markets improving and possibly ready to move higher again. Look for Gold to continue its downward move or consolidate in a broad range. Crude Oil continues higher. The U.S. Dollar Index also looks to continue to the upside, while U.S. Treasuries resume their move lower. The Shanghai Composite may continue its bounce in its downtrend, but the Emerging Markets are biased to the downside. Volatility looks to remain low and drifting lower, keeping the bias higher for the equity index ETF’s SPY, IWM and QQQ. Their charts show that the IWM is the strongest and ready to continue higher. The SPY and QQQ still have some resistance to work through in their short term moves higher before they are in the clear to move higher. Use this information as you prepare for the coming week and trad’em well.
The information in this blog post represents my own opinions and does not contain a recommendation for any particular security or investment. I or my affiliates may hold positions or other interests in securities mentioned in the Blog, please see my Disclaimer page for my full disclaimer.
Original post
- English (UK)
- English (India)
- English (Canada)
- English (Australia)
- English (South Africa)
- English (Philippines)
- English (Nigeria)
- Deutsch
- Español (España)
- Español (México)
- Français
- Italiano
- Nederlands
- Português (Portugal)
- Polski
- Português (Brasil)
- Русский
- Türkçe
- العربية
- Ελληνικά
- Svenska
- Suomi
- עברית
- 日本語
- 한국어
- 简体中文
- 繁體中文
- Bahasa Indonesia
- Bahasa Melayu
- ไทย
- Tiếng Việt
- हिंदी
SPY Trends and Influencers: July 6, 2013
Published 07/06/2013, 01:26 AM
Updated 05/14/2017, 06:45 AM
SPY Trends and Influencers: July 6, 2013
3rd party Ad. Not an offer or recommendation by Investing.com. See disclosure here or
remove ads
.
Latest comments
Install Our App
Risk Disclosure: Trading in financial instruments and/or cryptocurrencies involves high risks including the risk of losing some, or all, of your investment amount, and may not be suitable for all investors. Prices of cryptocurrencies are extremely volatile and may be affected by external factors such as financial, regulatory or political events. Trading on margin increases the financial risks.
Before deciding to trade in financial instrument or cryptocurrencies you should be fully informed of the risks and costs associated with trading the financial markets, carefully consider your investment objectives, level of experience, and risk appetite, and seek professional advice where needed.
Fusion Media would like to remind you that the data contained in this website is not necessarily real-time nor accurate. The data and prices on the website are not necessarily provided by any market or exchange, but may be provided by market makers, and so prices may not be accurate and may differ from the actual price at any given market, meaning prices are indicative and not appropriate for trading purposes. Fusion Media and any provider of the data contained in this website will not accept liability for any loss or damage as a result of your trading, or your reliance on the information contained within this website.
It is prohibited to use, store, reproduce, display, modify, transmit or distribute the data contained in this website without the explicit prior written permission of Fusion Media and/or the data provider. All intellectual property rights are reserved by the providers and/or the exchange providing the data contained in this website.
Fusion Media may be compensated by the advertisers that appear on the website, based on your interaction with the advertisements or advertisers.
© 2007-2024 - Fusion Media Limited. All Rights Reserved.