Last week’s review of the macro market indicators saw, heading into the next week, that the markets looked strong but perhaps a bit extended. Gold (GLD) and Crude Oil (USO) looked ready to continue their moves higher with a possibility that gold consolidates first.
The US Dollar Index (UUP) and US Treasurys (TLT) were poised to continue lower, with Treasurys having the best chance for a bounce. The Shanghai Composite (SSEC) seemed bound by the 50 day SMA while Emerging Markets (EEM) were biased to the upside but at major resistance.
Volatility (VIX) looked to remain subdued keeping the bias higher for the equity index ETF’s SPY, IWM and QQQ. With the moves higher, each could be forgiven if they consolidated or had a slight pullback first and their charts did have some signs of being extended on the short run.
The week played out with gold holding at its highs while crude oil pulled back hard but stabilized later in the week. The US Dollar Index is trying to bottom while Treasurys rebounded slightly. The Shanghai Composite continued back down making a new lower low while Emerging Markets gave up some of their gains before moving back higher to end the week off the lows.
Volatility continued to hold at the lows remaining subdued. The Equity Index ETF’s consolidated their gains in bull flags, each trying to move higher Friday but failing to break. What does this mean for the coming week? Lets look at some charts.
SPY Daily (SPY)
SPY Weekly (SPY)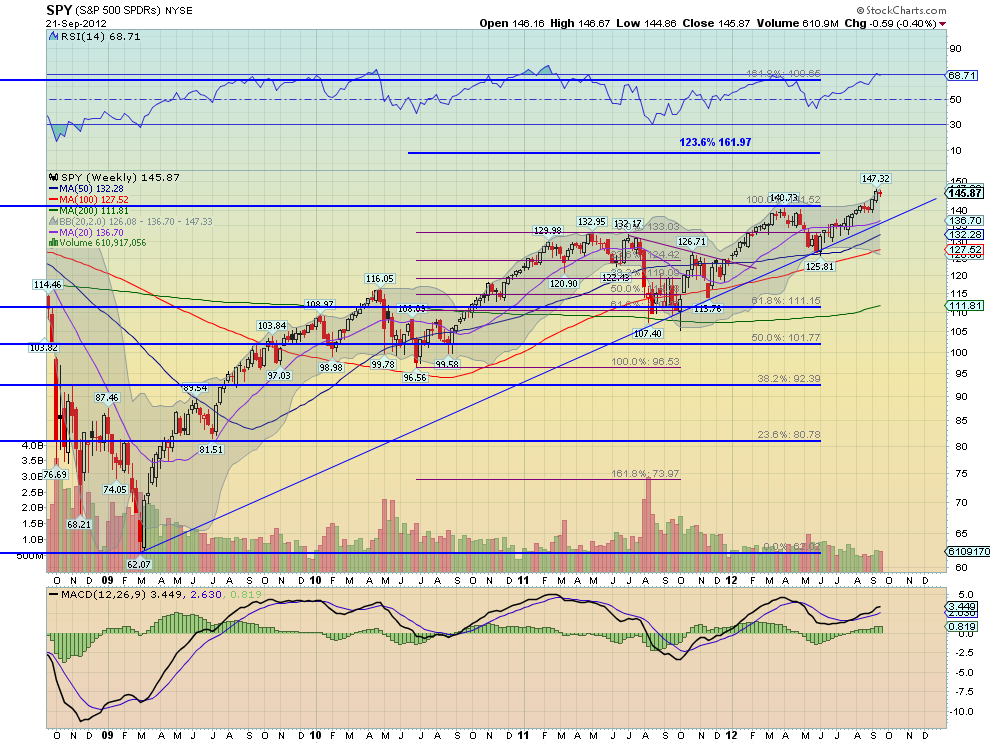
The SPY spent the week consolidating in a bull flag at the highs, continuing the stair step pattern of the last 6 weeks. The RSI on the daily timeframe is slightly overbought but working that off through time and the MACD is positive, but fading. This happens to the MACD in a flag.
The weekly picture shows the doji at the highs with a strong and bullish RSI and a MACD that is positive and growing. This looks like a healthy trend higher. Support below comes at the 144 and 141.80 followed by 140.80 and 140. Above the previous high there are targets from Measured Moves to 147.70 and 149.07. Consolidation with an Upward Bias in the Uptrend.
Heading into the first week of Autumn the market remain strong but with a few caution flags showing up. Gold looks to continue higher with Crude Oil continuing to pullback in the uptrend. The US Dollar Index continues to look week despite consolidating this week while US Treasurys consolidate with a bias lower. The Shanghai Composite looks horrible making new lows and nothing positive in the charts with Emerging Markets consolidating at resistance in the uptrend.
Volatility looks to remain low paving the way for the equity index ETF’s SPY, IWM and QQQ, to continue higher. This is supported by the view of a lower Dollar Index and lower Treasurys. The Index ETF’s themselves all appear strong and held through Options Expiration, but may continue to consolidate. Use this information as you prepare for the coming week and trade’m well.
Disclaimer: The information in this blog post represents my own opinions and does not contain a recommendation for any particular security or investment. I or my affiliates may hold positions or other interests in securities mentioned in the Blog, please see my Disclaimer page for my full disclaimer.
Original post
- English (UK)
- English (India)
- English (Canada)
- English (Australia)
- English (South Africa)
- English (Philippines)
- English (Nigeria)
- Deutsch
- Español (España)
- Español (México)
- Français
- Italiano
- Nederlands
- Português (Portugal)
- Polski
- Português (Brasil)
- Русский
- Türkçe
- العربية
- Ελληνικά
- Svenska
- Suomi
- עברית
- 日本語
- 한국어
- 简体中文
- 繁體中文
- Bahasa Indonesia
- Bahasa Melayu
- ไทย
- Tiếng Việt
- हिंदी
SPY Trends And Influencers, Markets Look Strong
Published 09/23/2012, 03:21 AM
Updated 05/14/2017, 06:45 AM
SPY Trends And Influencers, Markets Look Strong
Latest comments
Loading next article…
Install Our App
Risk Disclosure: Trading in financial instruments and/or cryptocurrencies involves high risks including the risk of losing some, or all, of your investment amount, and may not be suitable for all investors. Prices of cryptocurrencies are extremely volatile and may be affected by external factors such as financial, regulatory or political events. Trading on margin increases the financial risks.
Before deciding to trade in financial instrument or cryptocurrencies you should be fully informed of the risks and costs associated with trading the financial markets, carefully consider your investment objectives, level of experience, and risk appetite, and seek professional advice where needed.
Fusion Media would like to remind you that the data contained in this website is not necessarily real-time nor accurate. The data and prices on the website are not necessarily provided by any market or exchange, but may be provided by market makers, and so prices may not be accurate and may differ from the actual price at any given market, meaning prices are indicative and not appropriate for trading purposes. Fusion Media and any provider of the data contained in this website will not accept liability for any loss or damage as a result of your trading, or your reliance on the information contained within this website.
It is prohibited to use, store, reproduce, display, modify, transmit or distribute the data contained in this website without the explicit prior written permission of Fusion Media and/or the data provider. All intellectual property rights are reserved by the providers and/or the exchange providing the data contained in this website.
Fusion Media may be compensated by the advertisers that appear on the website, based on your interaction with the advertisements or advertisers.
© 2007-2024 - Fusion Media Limited. All Rights Reserved.