The SPX trend is to the upside but the index ended the cycle from 2.2016 and like every other Index, it is correcting that cycle. In Elliott Wave Theory, corrections run in the sequences of 3-7-11 swings and consequently trading against the main trend which is to the upside is always risky.
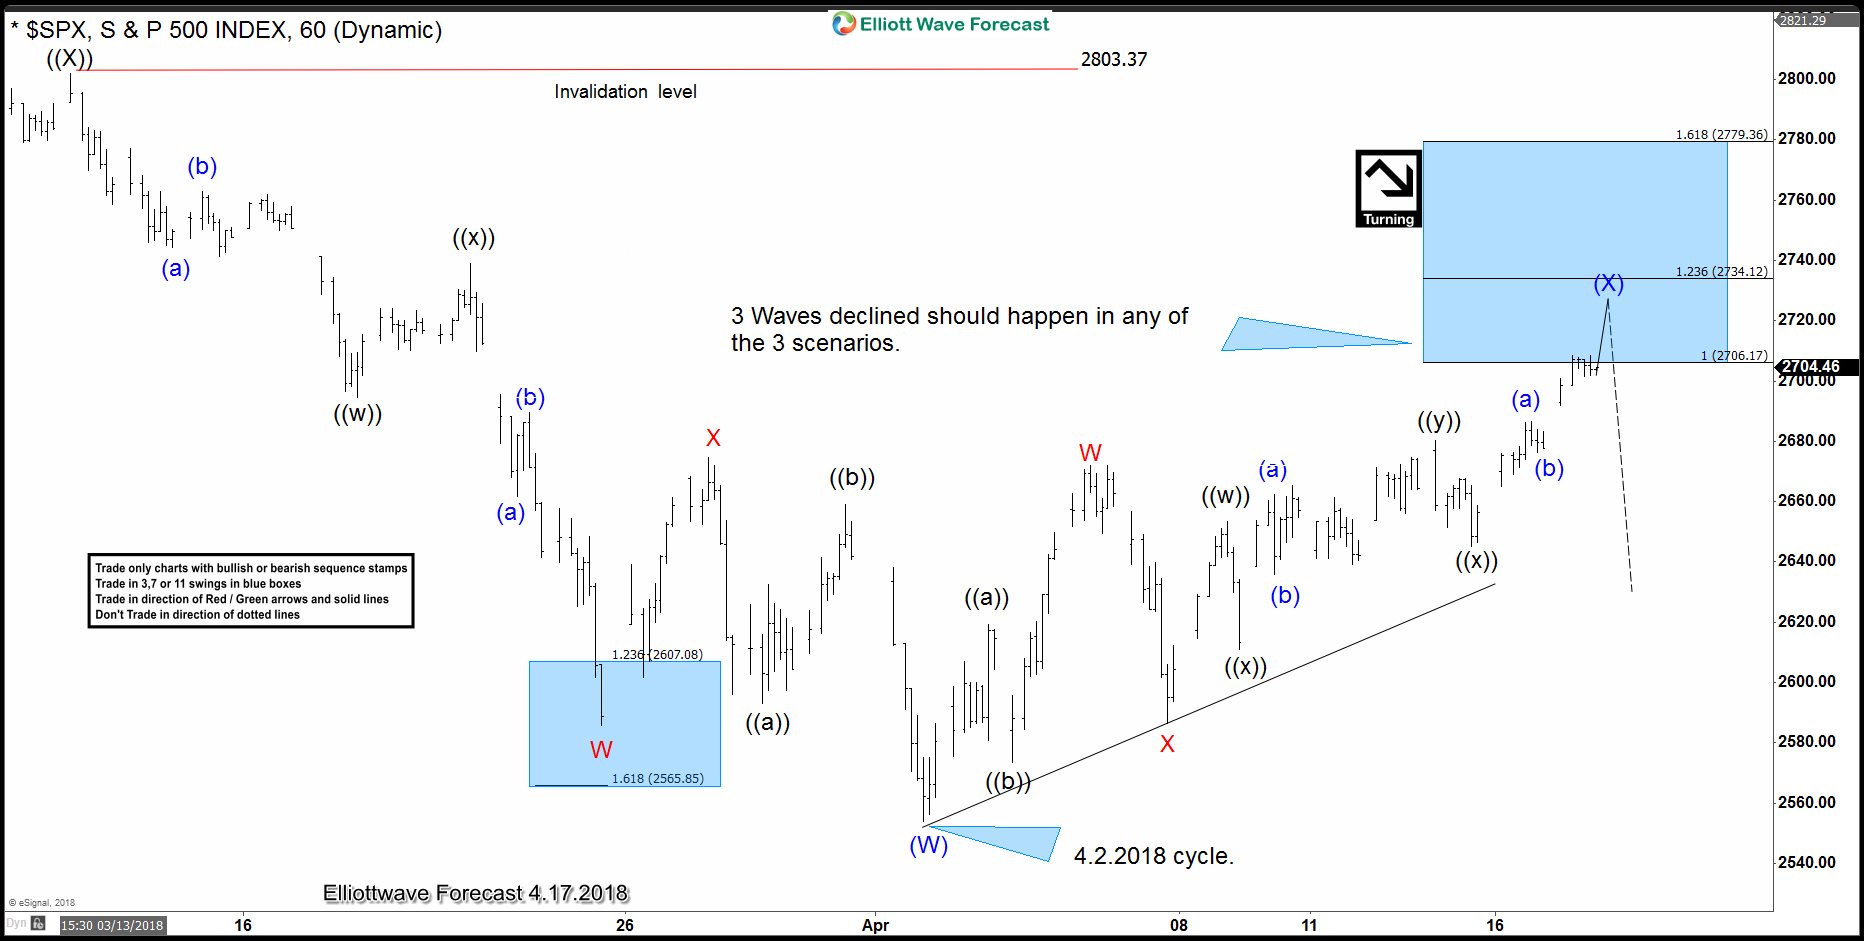
We do understand the Market Nature and we are able to see all possible paths or possibilities a Market can do. The index is reaching the Blue Box from the low at 4.2.2018 and soon it should pullback in 3 waves into a definition of the higher degree trend.
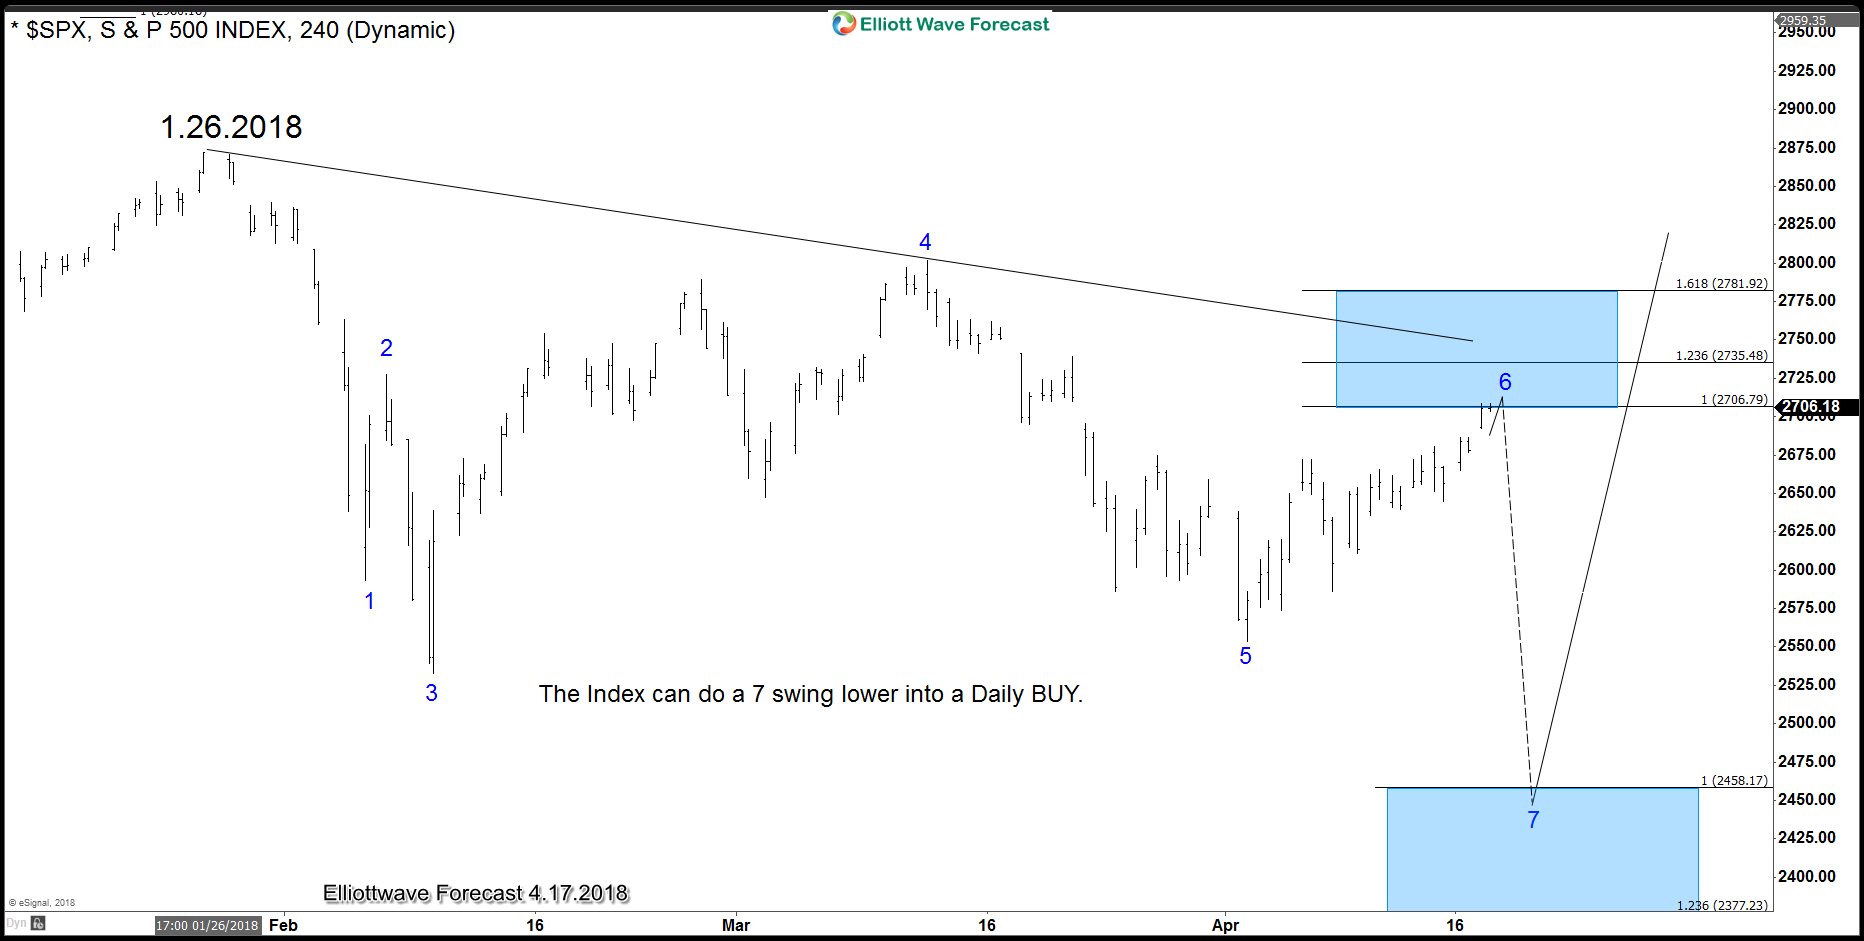
The move from 4.2.2018 is a 15 minutes cycle and the Market is combination of time frames. We are currently presenting to members the scenario which takes the Index to 2461 but we do not see any bearish sequences calling lower so we do not recommend selling, otherwise we recommend waiting for the market to reach the extreme to buy or create a short-term bearish sequence before selling intra-day bounces. If reaction lower from the blue box manages to break below April low, that would create a 15 minute bearish sequence down from 3.13.2018 peak.
The following chart is showing the cycle from 4.2.2018 and consequently the Blue Box in 15 minutes.
1. The Index reaches our area (Blue Box) to end a corrective cycle from 4.2.2018 and then consequently will extend lower into a 4 Hour extreme since peak at 3.13.2018, this is the most Bearish scenario and should provide a nice area to go long around 2461.

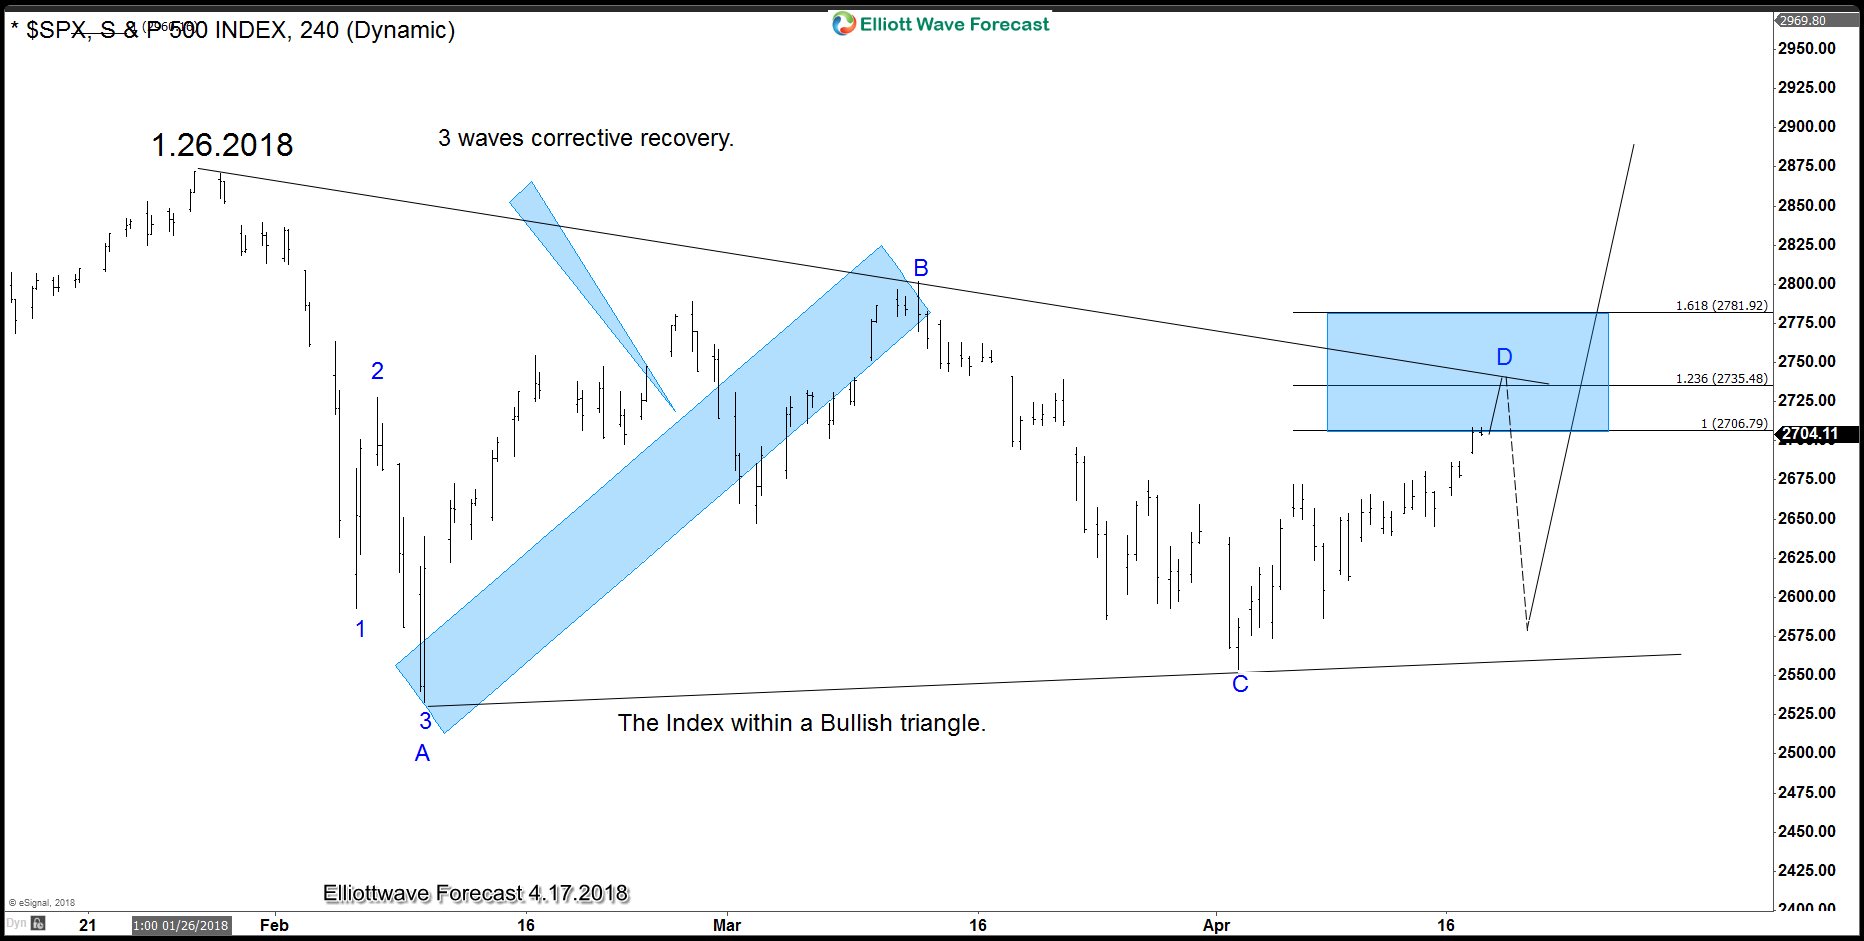
2. The $SPX index reaches our area (Blue Box) in which 3 waves from 4.2.2018 ends and instead of breaking lower into 2461 area, the index remain trapped between 2.9.2018 low and 3.13.2018 peak creating either a Bullish or Bearish triangle.

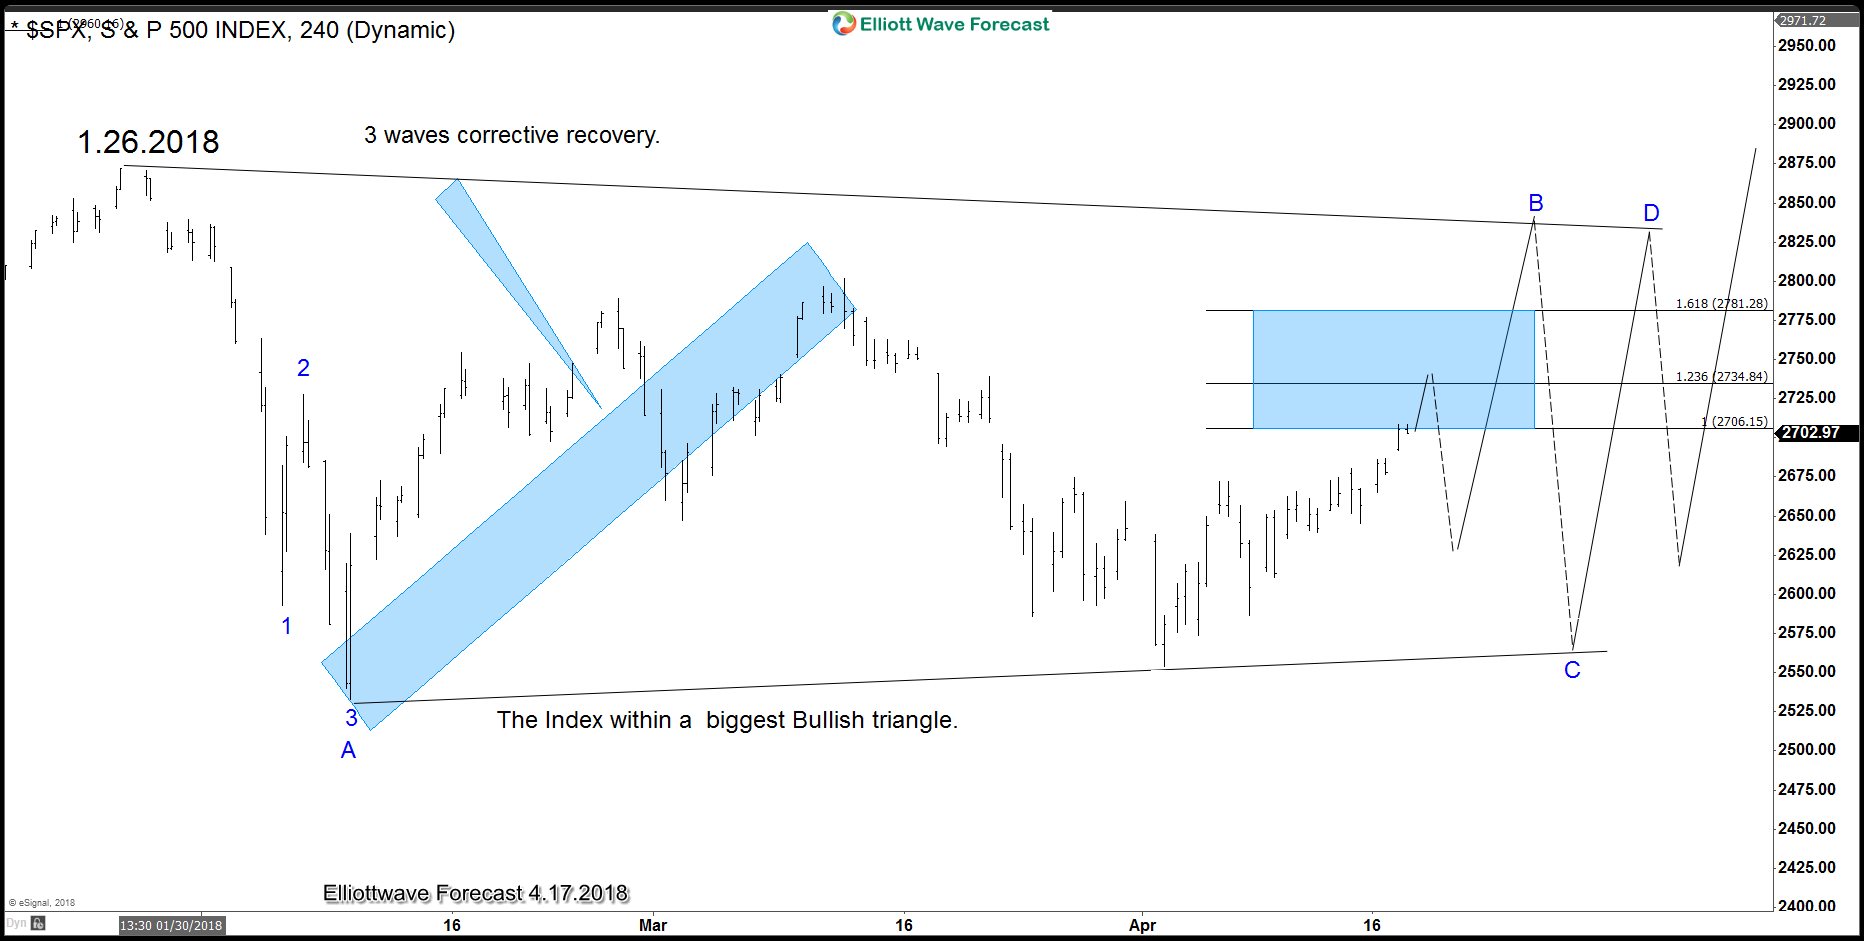
3. The $SPX index reaches our area (Blue Box) in which 3 waves from 4.2.2018 ends and pullback in 3 waves, then rally into 2822 in which case either become a Bullish triangle or renew of the higher degree trend.

As we can see the Market is calling for a pullback from the area between 2706-2779. We do understand the Nature of the Market and always educate members to wait for the extremes and then trade with the trend, consequently even when Elliott wave hedging now is calling a pullback, the Market needs to clear the path and define which scenario is playing out. The declined from 2706-2779 area will defined the path and consequently better opportunities will present in the near future, waiting and understanding the nature of the structure sometimes is better than guessing.
