Get 40% Off
🚨 Volatile Markets? Find Hidden Gems for Serious Outperformance
Find Stocks Now

SPX Price Targets. What To Watch

Published 06/22/2020, 02:45 AM
Updated 07/09/2023, 06:31 AM

Further to my post of June 15, the SPX pushed above 3080.20 to reach a high of 3155.53 on Friday, as shown on the daily chart below.

 
I've shown two Fibonacci Extensions (one taken from the March low and the other taken from the June low), as well as an Andrew's Pitchfork (taken from the March low), and a Williams Alligator (formed by three moving averages, each offset into the future).
 
There are two areas of price confluence zones (targets) above the current price. The first is a minor confluence zone around the 3250 level (where two of the Fib Extension levels converge). The second is a major confluence zone around 3350 (where two of the Fib Extension levels converge with the bottom of the Andrew's Pitchfork channel).
 
The SPX closed on Friday just above the upper-most moving average of the Alligator. As well, all three moving averages are either curled upwards or in the process of doing so, hinting of higher prices ahead. I'd like to see the momentum indicator reverse its negative reading and push through and hold above the zero level to confirm any rally higher to either of these price targets in the short term.
 
Otherwise, we may see the SPX retest its June low of 2965.66, or lower.
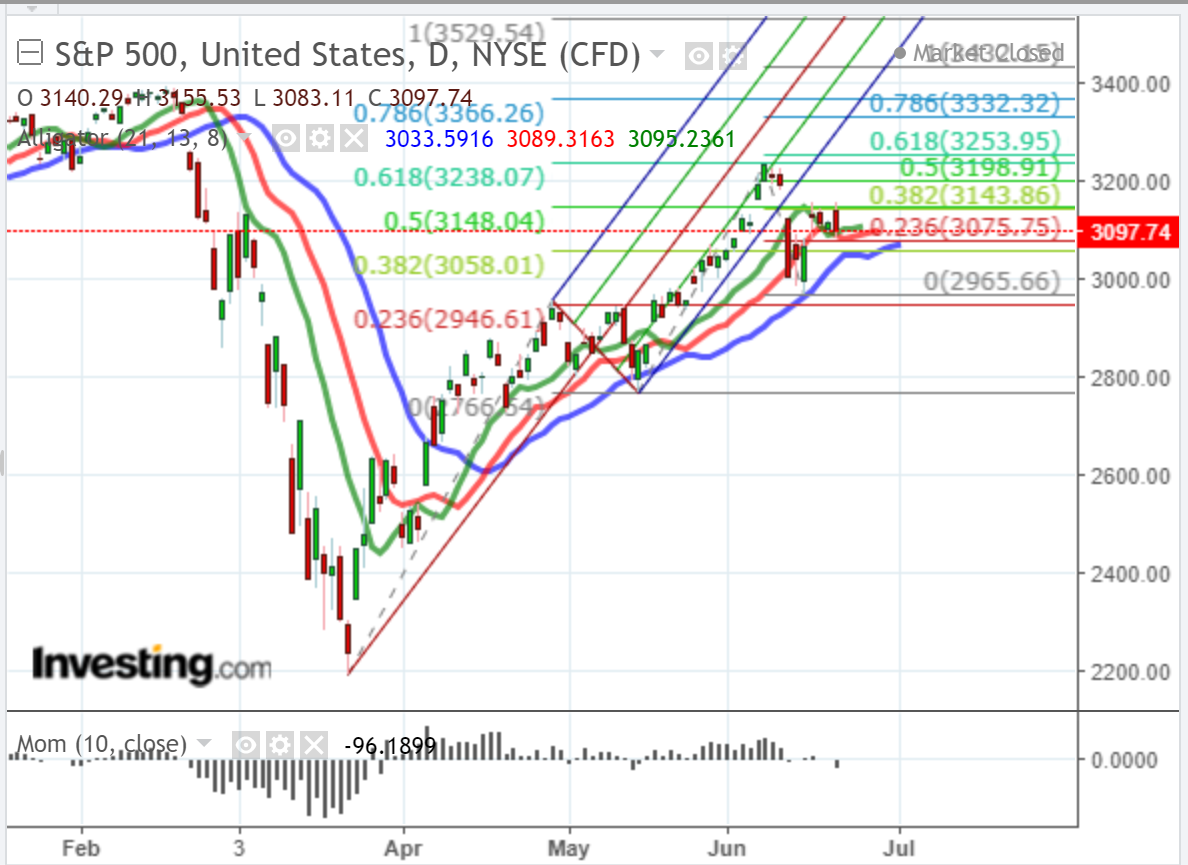
S&P 500 Daily Chart

Latest comments

Risk Disclosure: Trading in financial instruments and/or cryptocurrencies involves high risks including the risk of losing some, or all, of your investment amount, and may not be suitable for all investors. Prices of cryptocurrencies are extremely volatile and may be affected by external factors such as financial, regulatory or political events. Trading on margin increases the financial risks.
Before deciding to trade in financial instrument or cryptocurrencies you should be fully informed of the risks and costs associated with trading the financial markets, carefully consider your investment objectives, level of experience, and risk appetite, and seek professional advice where needed.
Fusion Media would like to remind you that the data contained in this website is not necessarily real-time nor accurate. The data and prices on the website are not necessarily provided by any market or exchange, but may be provided by market makers, and so prices may not be accurate and may differ from the actual price at any given market, meaning prices are indicative and not appropriate for trading purposes. Fusion Media and any provider of the data contained in this website will not accept liability for any loss or damage as a result of your trading, or your reliance on the information contained within this website.
It is prohibited to use, store, reproduce, display, modify, transmit or distribute the data contained in this website without the explicit prior written permission of Fusion Media and/or the data provider. All intellectual property rights are reserved by the providers and/or the exchange providing the data contained in this website.
Fusion Media may be compensated by the advertisers that appear on the website, based on your interaction with the advertisements or advertisers.
© 2007-2024 - Fusion Media Limited. All Rights Reserved.