Get 40% Off
🎁 Free Gift Friday: Copy Legendary Investors' Portfolios in One ClickCopy for Free

SPX Pivot Point Values for Week Of July 20

Published 07/19/2020, 12:02 AM
Updated 07/09/2023, 06:31 AM

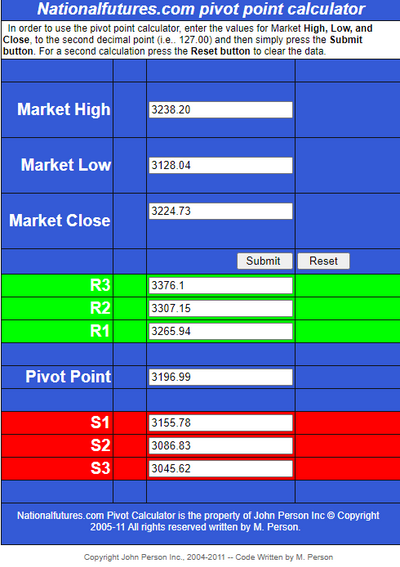
The pivot point support/resistant values/targets for the S&P 500 Index (SPX) for the week of July 20 are based on the high/low/close for the July 13 weekly candle, as shown on the following pivot point calculator.
Pivot Point Calculator

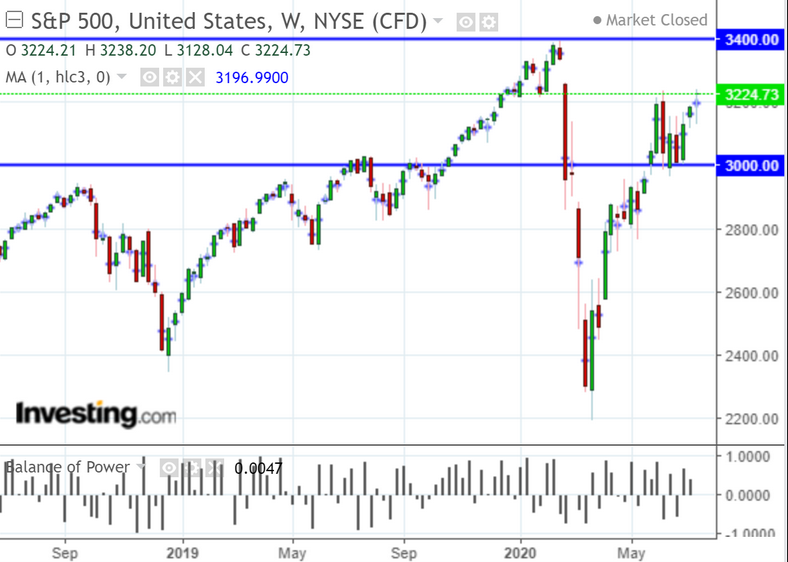
The PP of each weekly candle is depicted as a blue cross on the weekly chart of the SPX below.
 
You can see, at a glance, where the current price is relative to those...giving an indication as to its relative strength/weakness as the price moves above/below each one in the coming days and weeks.
 
On Friday, it closed above the PP for the July 20 week and only remains below the PPs of the weeks of December 23 to February 17...which represents relatively minor resistance, considering that it fought through all of 2018, most of 2019, and most of the 2020 overhead resistance since the March low.
 
R1 sits at 3265.94 and S1 at 3155.78, which represent near-term resistance and support levels or targets. 
 
If the SPX holds above this week's PP of 3196.99, there's a good chance it will reach R1, or higher; otherwise, a drop and hold below it could see it hit S1, or lower.
SPX Weekly Chart

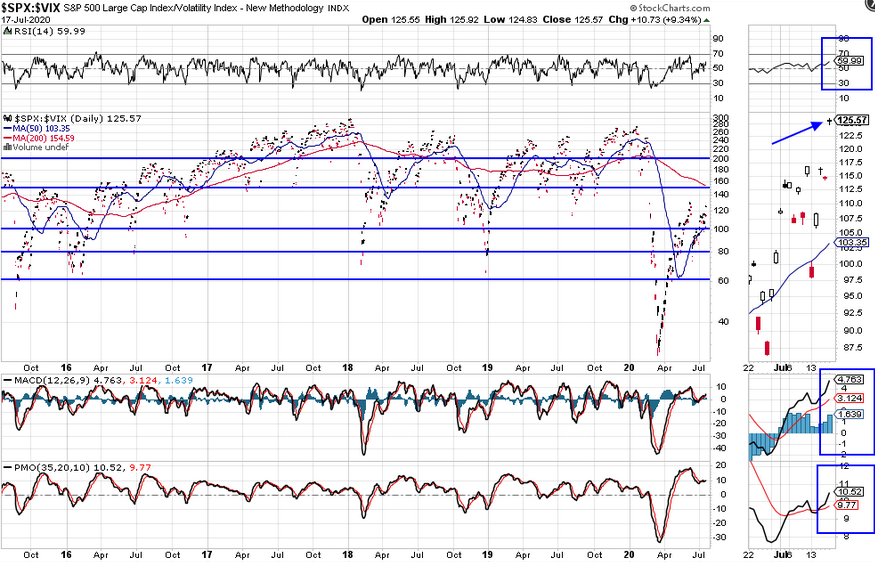
Volatility has dropped off the past couple of weeks, as the SPX:VIX ratio broke above the 100 level, once more, as shown on the following daily ratio chart.

 
Its target is the 200-day moving average around the 150-155 level, which converges with the next level of major price resistance.
 
The RSI, MACD and PMO technical indicators are all bullish, so look for that to continue in order to confirm any further sustainable rally on both the SPX:VIX ratio and the SPX
3rd party Ad. Not an offer or recommendation by Investing.com. See disclosure here or remove ads .
 
Otherwise, any hesitation or reversal on these would not bode well for SPX buyers...particularly if the SPX drops and holds below the PP at 3196.99, and, especially, if the Balance of Power flips from buyers to sellers on the weekly timeframe (falls and remains below zero).
SPX VIX Ratio

Latest comments

Risk Disclosure: Trading in financial instruments and/or cryptocurrencies involves high risks including the risk of losing some, or all, of your investment amount, and may not be suitable for all investors. Prices of cryptocurrencies are extremely volatile and may be affected by external factors such as financial, regulatory or political events. Trading on margin increases the financial risks.
Before deciding to trade in financial instrument or cryptocurrencies you should be fully informed of the risks and costs associated with trading the financial markets, carefully consider your investment objectives, level of experience, and risk appetite, and seek professional advice where needed.
Fusion Media would like to remind you that the data contained in this website is not necessarily real-time nor accurate. The data and prices on the website are not necessarily provided by any market or exchange, but may be provided by market makers, and so prices may not be accurate and may differ from the actual price at any given market, meaning prices are indicative and not appropriate for trading purposes. Fusion Media and any provider of the data contained in this website will not accept liability for any loss or damage as a result of your trading, or your reliance on the information contained within this website.
It is prohibited to use, store, reproduce, display, modify, transmit or distribute the data contained in this website without the explicit prior written permission of Fusion Media and/or the data provider. All intellectual property rights are reserved by the providers and/or the exchange providing the data contained in this website.
Fusion Media may be compensated by the advertisers that appear on the website, based on your interaction with the advertisements or advertisers.
© 2007-2024 - Fusion Media Limited. All Rights Reserved.