On Saturday, I posted Putting Low Stock Volatility to Good Use (Guest Columnist at Barron’s) and used that opportunity to expand upon some of the points I raised in my February 18th column for Barron’s. Specifically, I addressed the issue of the clustering of low volatility and used a graphic to show that when the VIX closes below 12, it tends to persist in these low readings, clustering for several years, before remaining above 12 for even longer periods during high volatility regimes.
Another claim I made in the Barron’s article that I thought might benefit from a little graphical support was my contention:
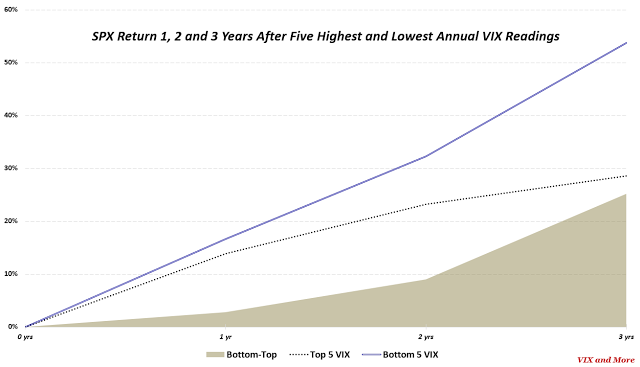
“VIX data suggests the low volatility provides a foundation for extended bullish moves in stock. Look at the five highest and lowest average annual VIX readings and calculate the performance of the Standard & Poor’s 500 index one, two, and three years after the VIX extremes. After one year, the S&P performance following the low VIX is about 20% higher than after the high VIX. For two years, the difference jumps to 40% and by the third year the cumulative performance differential is approximately 90%. Wariness aside, low volatility begets low volatility and is generally bullish for stocks.”
Now there are two ways to compare percentages and the best way for me to illustrate this is with an example. If we are comparing 5% with 4% is the 5% value 25% higher than 4% or is it 1% higher? You can make a case for either comparison, one of which is made with division and is more of a pure percentage calculation, while the other which is made by subtraction and is perhaps best thought of in terms of percentage points. In the Barron’s article, I used the division/percentage method, which is the norm when comparing numbers that are not percentages in and of themselves. This time around I will try to minimize confusion and use the subtraction/percentage points approach instead.
In the first of the two graphics below I have calculated the SPX 1-year, 2-year and 3-year returns following the years with the five highest average VIX values (2008, 2009, 2002, 2001 and 1998) with a dashed black line as well as the years with the five lowest average VIX values (1994, 1993, 2006, 2005 and 1994) with a solid double blue line. In all three time frames, the better returns followed the lower VIX readings and I used a green area series to show the (percentage point) difference.

[source(s): CBOE, Yahoo (NASDAQ:YHOO), VIX and More]
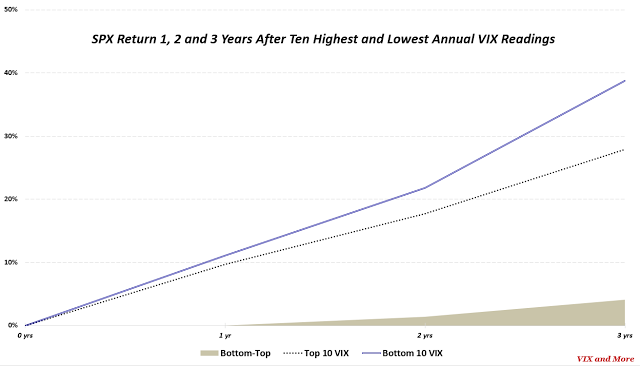
For comparison purposes, in the second graphic below I have plotted the same SPX 1-year, 2-year and 3-year returns following the years with the ten highest average VIX values as well as the years with the ten lowest average VIX values. Once again, in all three time frames, the better returns followed the lower VIX readings, though in this instance the performance gap between the lower VIX readings and higher VIX readings is somewhat reduced.

[source(s): CBOE, Yahoo, VIX and More]
I offer up these graphics because I maintain that there are many skeptics regarding not only the persistent clustering of low VIX readings, but also related to the lack of robust data showing the effect of mean reversion during low volatility regimes. As I have noted previously, mean reversion is much more predictable and tradeable following a VIX spike than after a significant decline in the VIX.
Disclosure(s): the CBOE is an advertiser on VIX and More
