Current Position of the Market
SPX: Long-term trend –Is the long-term trend resuming? Is this a B-wave? Too early to tell!
Intermediatetrend– Warning from leading indexes. Top of B-wave possible.
Analysis of the short-term trend is done on a daily basis with the help of hourly charts. It is an important adjunct to the analysis of daily and weekly charts which discusses the course of longer market trends.
Market Overview
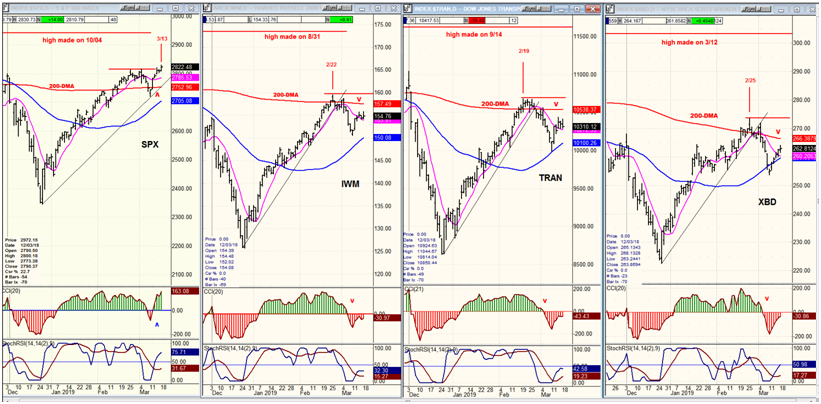
I am sure that I am not the only analyst who keeps an eye on the Russell 2000 index to evaluate the market trend. It has an excellent record of signaling important turns in the market. As an example, when SPX made its October 4, 2018 high and started the most important correction since May 2015, IWM had already been in a decline for about a month. But there are others that appear to have the same intuitive ability! The Dow transportation index topped on 9/14/18, and XBD had been a full-fledged downtrend since 3/12/18. Advance warning was also given by iShares Russell 2000 (NYSE:IWM) and XBD in 2007 well ahead of the market peak. Given these indexes’ apparent predictive propensity, it would behoove us to note where they stand today in relationship to SPX. Here is an up-to-date daily chart of all four indexes:
All three“leading” indexes made their highs relative to SPX about three weeks ago, as they were decisively repelled by their 200-DMA. It could be an early warning of market weakness ahead, but since the time difference between tops is relatively short (about 3 weeks), we need to wait for a little more confirmation that this is a valid sell signal. The first thing to look for will be to see if they begin to decline below their blue 50-DMA. Note that all four 50-DMAs (including SPX’) are trading below their 200-DMAs which, to many analysts, is also a sign of long-term weakness. Let’s give it another week to see if there is any change in the relationships before speculating further on what it means.
SPX daily chart
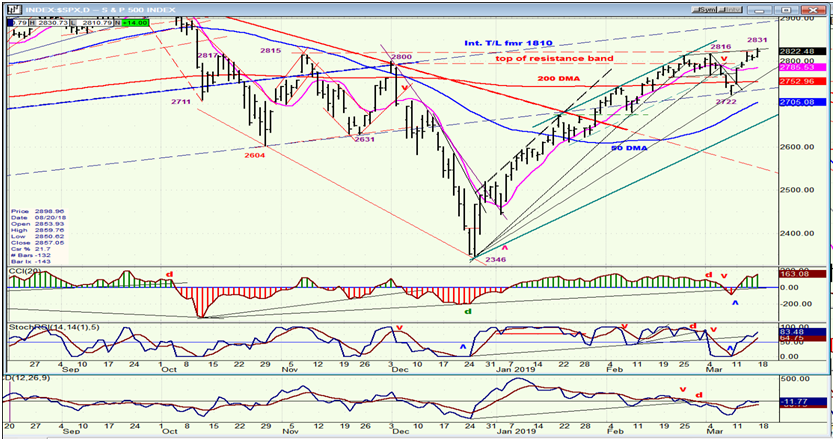
Last week, SPX made up all the loss of the previous week, plus a little more; but by Friday, it looked as if it was ready to pull back. If there is anything to the underperformance of the three leading indexes mentioned above, then signs of weakness should soon appear in SPX and other benchmark indices. As a side note, DJIA is already relatively weak, but since this is primarily due to one of its components (BA), we need additional evidence. Friday’s rally to a slightly higher high was probably the result of options expiration and with that behind us, we could resume the downward tendency which was apparent on Thursday.
Before we go down, we have to stop going up. And if we can refrain from making a new high next week, we’ll have a good start on beginning a trend reversal. Quickly dropping below 2800 would be the first step, followed by a challenge to the 2722 level. Ever since the 2346 low, SPX has been making a series of higher highs and higher lows. These have created the uptrend! Therefore, breaking last week’s 2722 low will be our first objective toward extending the correction which attempted to start last week. The fact that the three leading indexes listed above ignored last week’s rally is not a bullish sign.
And if we resume the correction, what can we expect? Once again, we can turn to the Fibonacci ratios for an estimate. The normal, minimum retracement of a completed uptrend is .382. So if we do complete this uptrend at 2831, .382 of the 485-point rally from 2346 to 2831 would be 185 points, or a decline down to 2646 before we should look for another reversal to the upside. Of course, we made the same argument two weeks ago, but we stopped well short of our downside projection and went on to make a new high. But then, we did not have relative weakness showing in our three leading indexes!
We should also consider that, at the end of the week, the three oscillators were not all that bullish for an index making a new high -- especially the A/D indicator which never did become positive during the week in spite of a 109-point rally!
SPX hourly chart
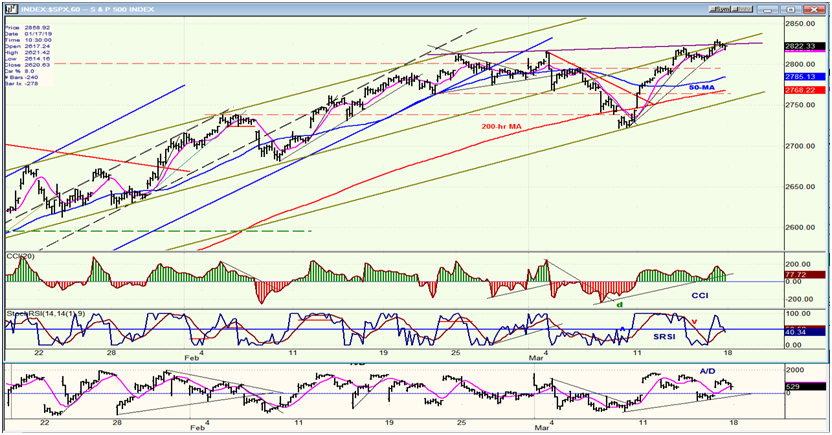
With just a quick glance at this chart, it would not be surprising if we were getting ready to reverse the trend for a consolidation, at least(and perhaps more). Some analysts have not given up on the idea that this is a B-wave from 2346 and that we may be ready to start on the C-wave to challenge the former low. After all, the expectation was for the correction to retrace about .382 of wave 3 (from 1011 on 6/27/10) which would have taken us to about 2200 and good support, instead of stopping precisely at the 200-wk MA and rallying from there. In the next section, we will also see why the extent of the rally in all four indexes would have a good technical reason to end at this level -- whether or not this results in the beginning of a C-wave.
But here, we are concerned with the short term. On Wenesday, SPX met with resistance at the extension of the trend line drawn across the two former tops as well as at the extension of the broken, green channel line(which is known as a kiss-back). If prices were rescued by Friday’s options expiration, which caused them to retest the two trend lines one more time (and being pushed back one more time, into the close) we should see some selling appear by Monday’s opening. The lack of negative divergence in the CCI does not make Friday’s top as serious as it could be, but the rounding top pattern itself is not that bullish looking either.
SPX, IWM (wkly)
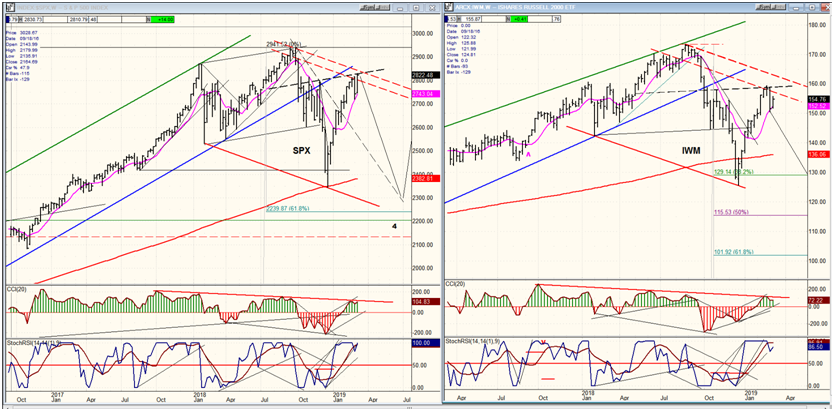
This week, I will only post two weekly charts -- that of SPX and IWM -- so I can show you more clearly why we could very well stop the rally from 2346 (SPX) in this area, so that it becomes only half of the corective pattern from the top. First, note that IWM did correct a full .382 of the former wave 3 from 2010, while SPX stopped short, finding support on the 200-wkly MA and could, conceivably, complete the rest of a normal retracement.
More importantly, I have drawn a corrective channel in red and, as you can see, both indexes have now risen to the top of the channel with IWM already finding resistance at the lower of the two top channel lines. Also providing resistance to both indexes is the dashed black line drawn as a parallel to the initial lows of the correction. This does not ensure that thisrally is a B-wave, but it does suggest that a retracement is likely from this level.
UUP (Dollar ETF) (daily)
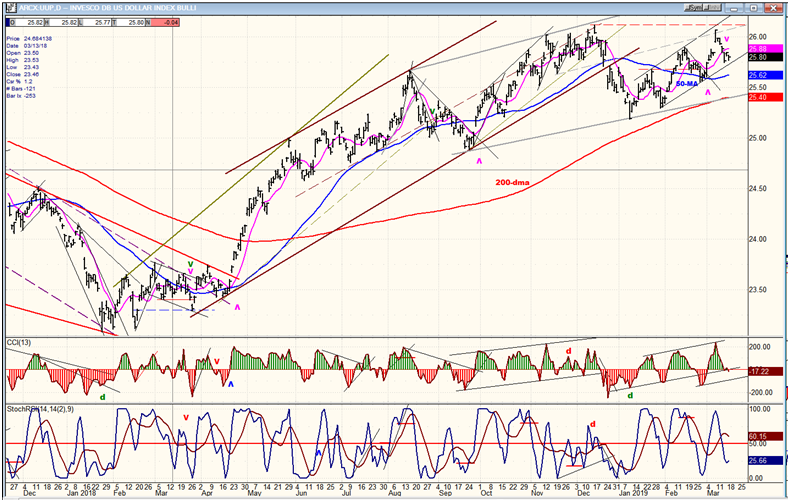
After re-testing its high, PowerShares DB US Dollar Bullish (NYSE:UUP) has pulled back to the bottom of a new up-channel. Even if it breaks the short-term trend line, it does not mean that it is starting a major correction. For that, it would have to drop below the 200-DMA and keep going. While some additional consolidation around this level cannot be excluded, the odds of making a new high are still considered good.
GDX (NYSE:GDX) (Gold miners ETF) (daily)
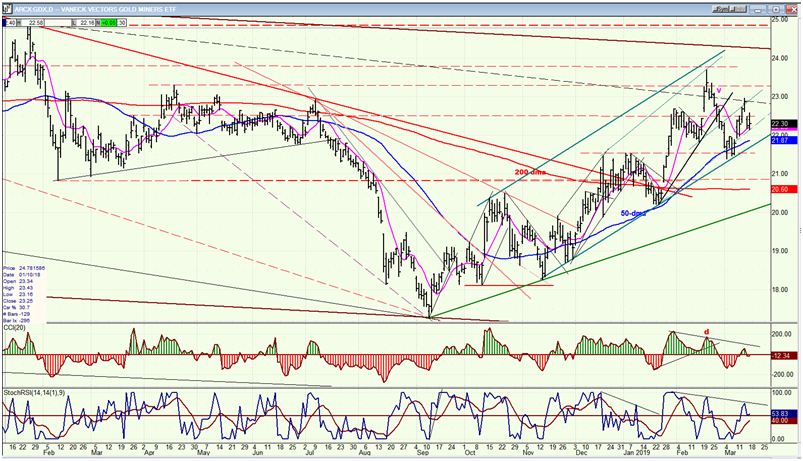
To some extent, the price of gold is dependent on what the dollar does, but it does have a life of its own and should be analyzed individually. It is not clear if GDX is now ready to extend its move to challenge the major top channel line at about 24.00, or if more consolidation will be required, first. This will primarily depend on whether or not it can hold above its current trend line from 18.50. Doing so for the next few days could encourage buyers to step it, while an early break would result in another leg down before resuming an uptrend.
CGC (Canopy Growth) (daily)
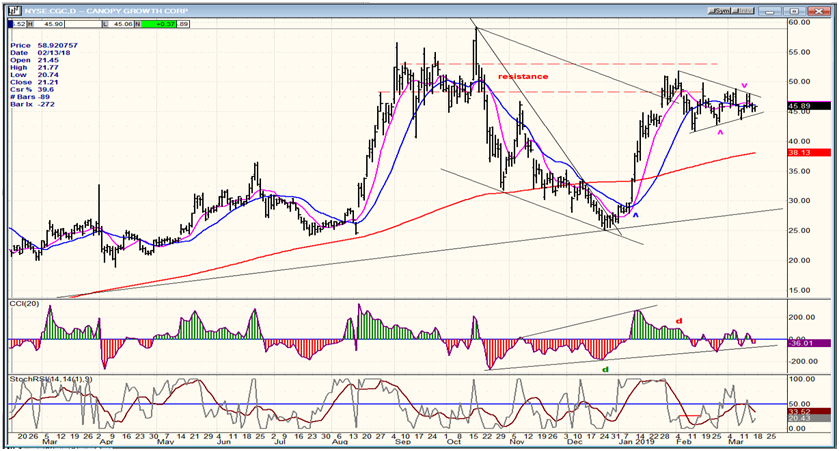
It’s now, or a missed opportunity for Canopy Growth Corp (NYSE:CGC) to move higher! Not sure how the stock would react if the market begins to correct. I suppose it will depend on the degree of the correction. It appears to be moving in tandem with the major averages.
BNO (United States Brent Oil Fund)(daily)
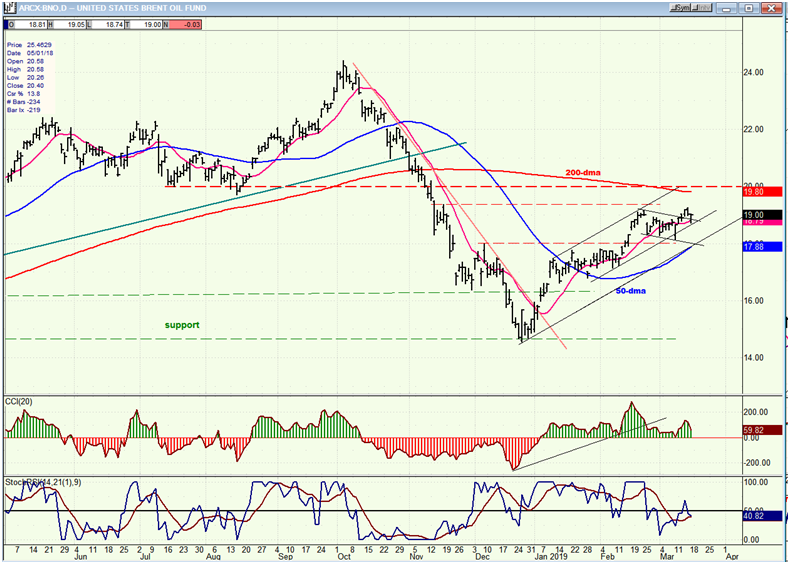
As expected, United States Brent Oil (NYSE:BNO) has pushed a little higher and does not look quite finished. However, its uptrend should be limited to the overhead resistance caused by the 200-DMA – if it can get that far!
Summary
There’s a good case to be made for the SPX to find a top in this general area and to start retracingat least a good part of its rally from 2346.
