Well. the long expected correction arrived Friday, September 9th, 2016, perhaps due to the 10-Year Treasury yield breaking out of its post-Brexit trading range, and ending the week at 1.67%.
Reading Bespoke’s weekly report at Saturday morning breakfast, just 35% of the S&P 500 remains above the 50-week moving average, so just with Friday’s drop in the major equity indices, some froth has been taken out of the market, just with Friday’s action.
What was interesting this past week was to watch the German Germany 10-Year “bund” yield return to positive territory for the first time in – what – two years and the Japanese bond also has started to rise in yield. (Although many do not like his politics, CNBC’s Rick Santelli gives an excellent international and US bond market perspective from the floor of the CME many times each day to CNBC listeners. He will update listeners on the action in the German bunds and the Japanese bond markets, as well the ECB and Euro markets. Pay attention to what is happening there, particularly if these trends continue. Rick’s analysis and commentary is quite good, although very nuanced, but I have no doubt much of his commentary goes over the head of CNBC viewers. )
I’m wondering when the last time was the global bond markets saw a “unified” or correlated rise in interest rates?
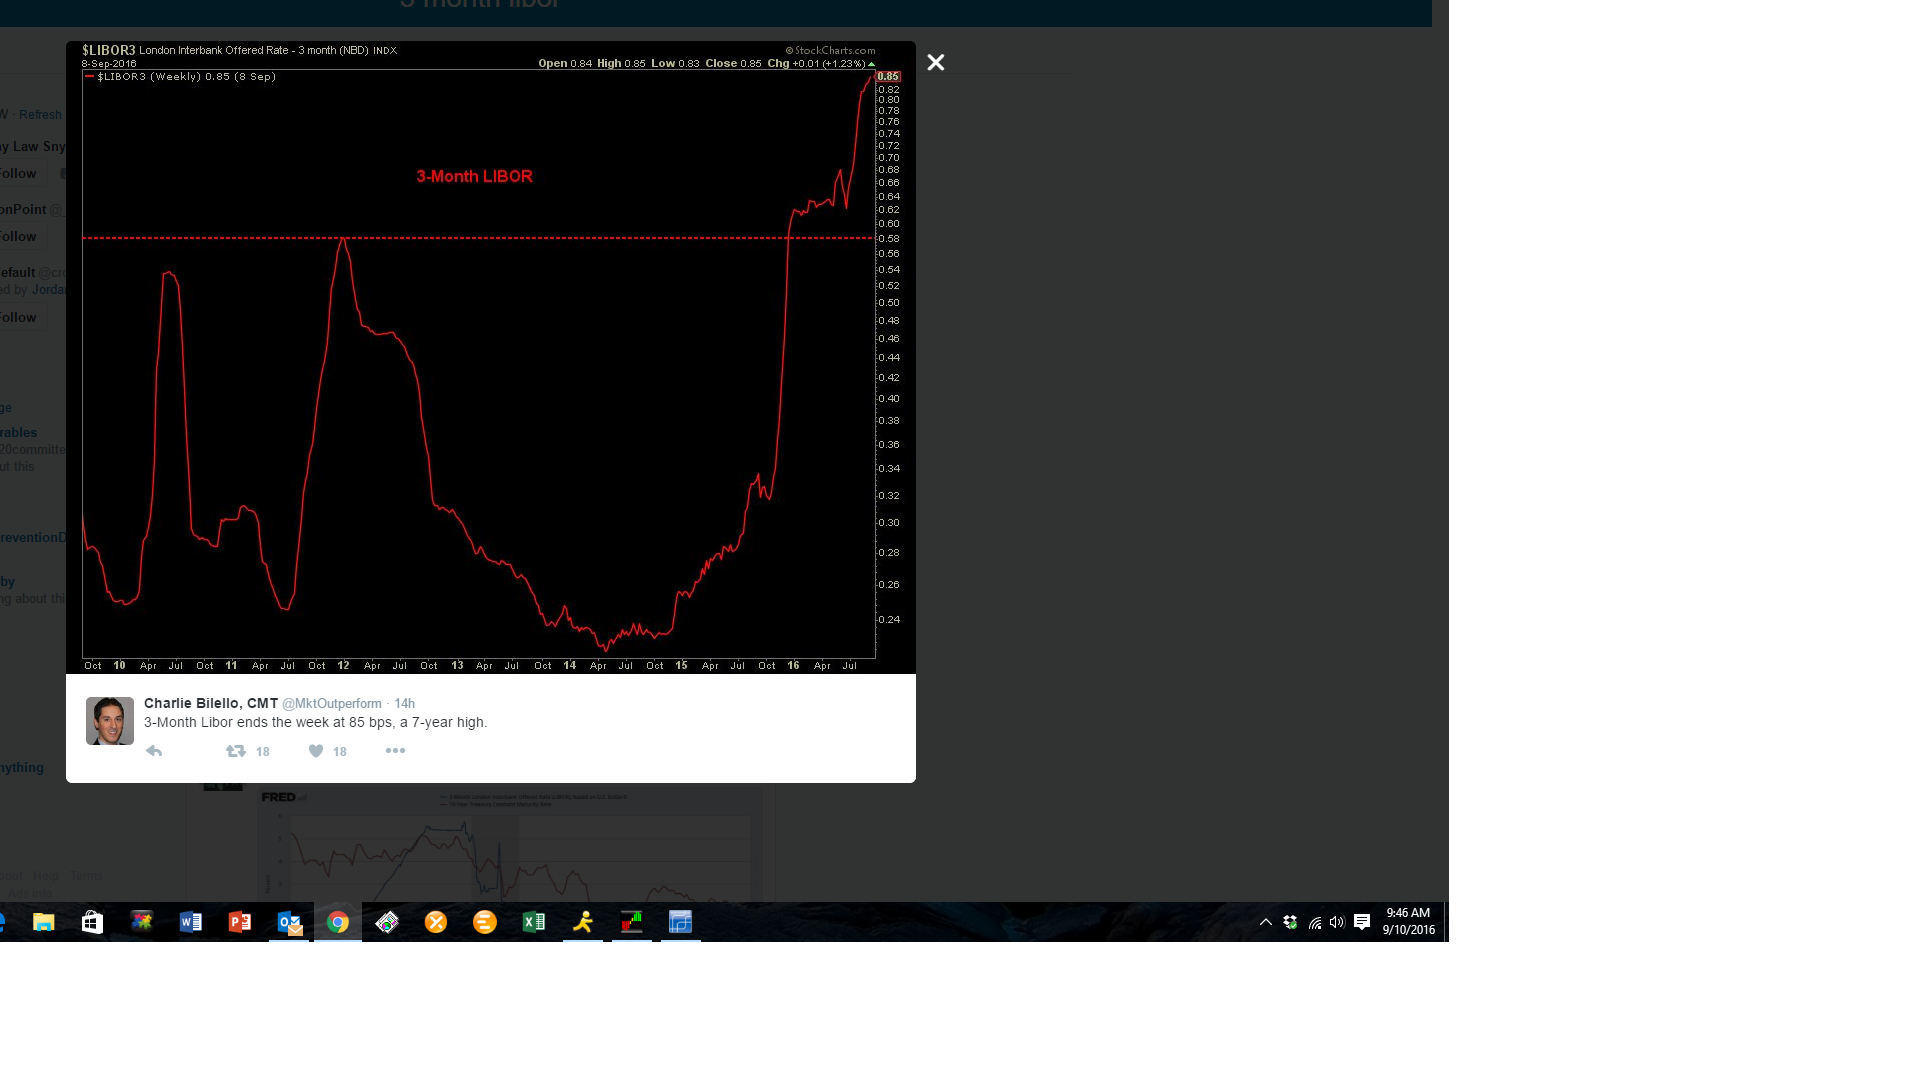
Maybe more interesting is the action in LIBOR. Here is a good article by Brad Thomas talking about money market reform and its possible impact on LIBOR.
Here is a chart of 3-month LIBOR taken from Charlie Bilello’s Twitter Post on Friday, 9/9/16:

Here is an older article from Bankrate.com on ARM’s and student loans tied to LIBOR. (I couldn’t find exactly how much of the mortgage market today is ARM’s and what percentage of those ARM’s are tied to LIBOR. That has to be an important question to ask, particularly if the rise in LIBOR continues.)
However, what worries me more than anything from an investor perspective, is that so many today feel that today’s interest rate environment is “normal” and interest rates will seemingly decline forever. (Note the continued inflows into mutual bond funds).
For someone studying Money and Banking in 1980 when Paul Volcker sent the fed funds careening from 15% to 20% to 6% in a year’s time and the Prime Rate hit 20%, all I can say to readers is, “things can change, and change quickly.”
I can remember the 10-point drop in the 30-year Treasury in March, 1987, which was one of the contributing causes to the October, 1987 crash. The US Treasury and various bond markets got CRUSHED in the first half of 1987, and absolute yields were far higher than than today. The 30-year Treasury yield rose from 7.86% at the close of 1986 to 10.2% just prior to the 1987 crash.
Watch that technical “double-bottom” in the 10-year Treasury yield near 1.39% – 1.40%, from both July, 2012 and July, 2016.
S&P 500 Earnings data (Thomson Reuters data “by the numbers”):
- Forward 4-quarter estimate: $125.85, versus $125.82. Again, it is unusual to see the 4-quarter estimate increase at this point in the quarter, which is a positive sign.
- P.E ratio: 16.9(x)
- PEG ratio: 8.5(x)
- S&P 500 earnings yield: 5.91% , and rocketed higher this week, from last week’s 5.77%.
- Year-over-year growth of forward estimate: +2.99% and now the highest rate since late April ’16. It is moving in the right direction, just at a slower rate than I expected, coming into 2016.
Earnings analysis: The forward growth rate continues to work higher, and more importantly the 2017 estimate continues to remain “rock-solid” in terms of 2017’s calendar EPS estimate. The normal pattern is to see healthy downward revisions to forward earnings estimates 3,6, and 9 months out from the quarter or year, and then the estimates start to stabilize and move higher as the quarter arrives. The fact that forward revisions are NOT being taken lower should portend favorably for future earnings (and future earnings growth) and should leave investors feeling more comfortable about expected future stock returns.
BUT, there is more to capital markets than just S&P 500 earnings growth.
Whatever might ail this market, after Friday’s drop and this long-awaited sell-off, S&P 500 earnings growth and how the math is developing for 2017, is one unambiguous positive at this point.
What I’ve told client’s at mid-year 2016 meetings is that if 10-year Treasury rates rise sharply and dramatically, it will be a shock to the S&P 500, but the large-cap segment of the US market, like the S&P 500, should find a bottom faster and reset quicker than the global bond markets. That is just one opinion, though.
