Get 40% Off
🤯 Perficient is up a mind-blowing 53%. Our ProPicks AI saw the buying opportunity in March.Read full update

S&P 500: Volatility And Its Relationship To Gamma Neutral

Published 12/04/2019, 12:51 PM
Updated 07/09/2023, 06:31 AM

The volatility of the S&P 500 has an interesting relationship to a metric which I call Gamma Neutral. Gamma Neutral is the theoretical price where the total gamma in the SPX options market is equal to zero.

The study of market gamma is basically the study of risk in the options market. A large portion of options trading is done under the premise of a delta-neutral hedging program. Since the "delta risk" has theoretically been hedged by the programmatic traders, "gamma" becomes the primary metric that risk managers must track and manage.
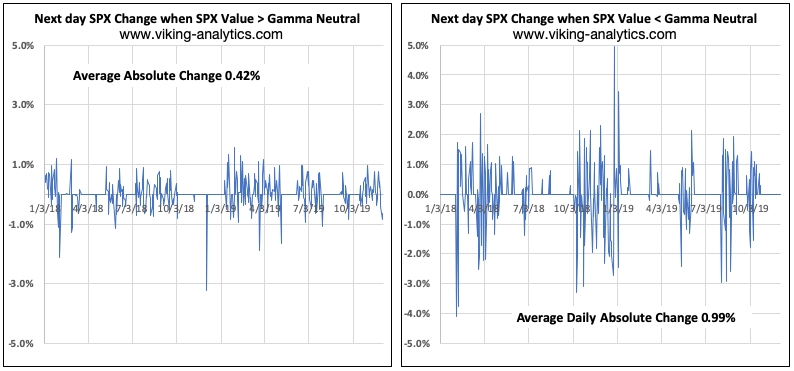
Next Day Closing Volatility

Not surprisingly, the volatility of the S&P 500 is therefore related to gamma metrics.

In the graphs above, we can see that the volatility of the S&P 500 is muted when the value of SPX closes above Gamma Neutral. When SPX closes below Gamma Neutral, volatility increases dramatically - on an absolute value basis, it more than doubles.

These are complicated topics, so please visit my website to learn more, or you can write to me at erik@viking-analytics.com.

Latest comments

Risk Disclosure: Trading in financial instruments and/or cryptocurrencies involves high risks including the risk of losing some, or all, of your investment amount, and may not be suitable for all investors. Prices of cryptocurrencies are extremely volatile and may be affected by external factors such as financial, regulatory or political events. Trading on margin increases the financial risks.
Before deciding to trade in financial instrument or cryptocurrencies you should be fully informed of the risks and costs associated with trading the financial markets, carefully consider your investment objectives, level of experience, and risk appetite, and seek professional advice where needed.
Fusion Media would like to remind you that the data contained in this website is not necessarily real-time nor accurate. The data and prices on the website are not necessarily provided by any market or exchange, but may be provided by market makers, and so prices may not be accurate and may differ from the actual price at any given market, meaning prices are indicative and not appropriate for trading purposes. Fusion Media and any provider of the data contained in this website will not accept liability for any loss or damage as a result of your trading, or your reliance on the information contained within this website.
It is prohibited to use, store, reproduce, display, modify, transmit or distribute the data contained in this website without the explicit prior written permission of Fusion Media and/or the data provider. All intellectual property rights are reserved by the providers and/or the exchange providing the data contained in this website.
Fusion Media may be compensated by the advertisers that appear on the website, based on your interaction with the advertisements or advertisers.
© 2007-2024 - Fusion Media Limited. All Rights Reserved.