
Recently, the stock market continued to rally, fueled by advances in a handful of tech sector stocks, but as I wrote on February 7, “We may have to deal with a correction or consolidation of several weeks of advances. With the season of quarterly earnings announcements coming to an end and a series of important economic data, profit taking may follow.”
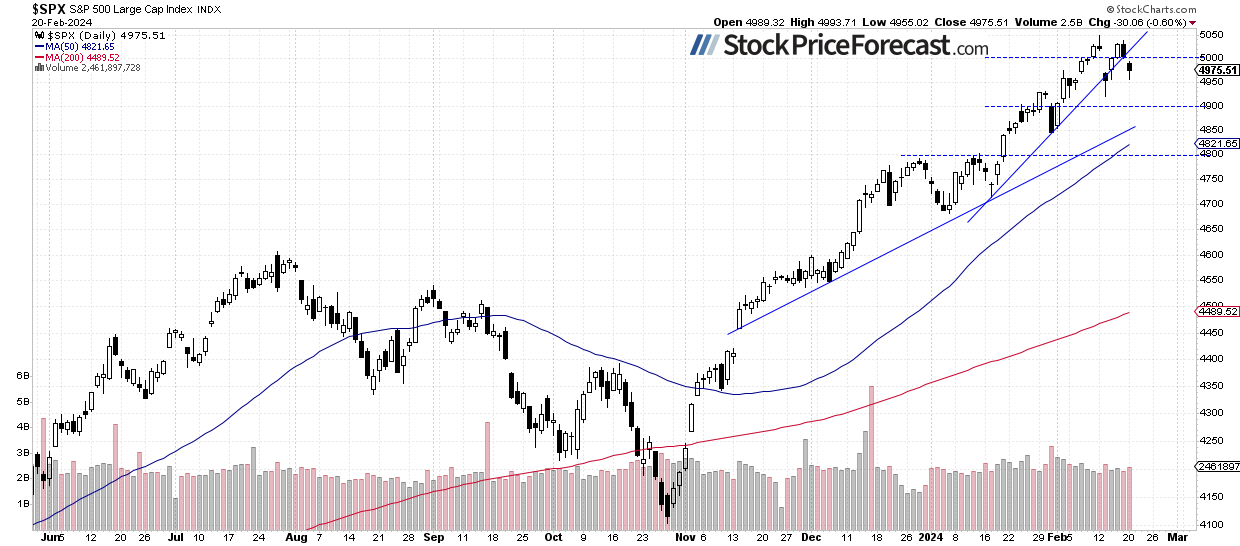
Yesterday, the S&P 500 index retraced more of its last week’s advances and a rebound from the last Tuesday’s local low of 4,920.31, declining by 0.60%. So, the market keeps confirming my February 7 analysis, as it is basically going sideways after reaching new record high of 5,048.39 on February 12. Last week, the market was rebounding, and it was on its way to re-test the all-time high; however, Friday’s producer inflation data halted that rally.
This morning, futures contracts are indicating a 0.3% lower opening for the trading session, slightly extending the recent decline. The market may see more uncertainty and a consolidation along the 5,000 level. Investors are now eagerly awaiting today’s quarterly earnings release from NVDA, to be announced after the session’s close, preceded by the FOMC Meeting Minutes release at 2:00 p.m.
Last week, investor sentiment has worsened a bit; Wednesday’s AAII Investor Sentiment Survey showed that 42.2% of individual investors are bullish, while 26.8% of them are bearish. The AAII sentiment is a contrary indicator in the sense that highly bullish readings may suggest excessive complacency and a lack of fear in the market. Conversely, bearish readings are favorable for market upturns.
Last Tuesday, I mentioned, "The market may return to a month-long upward trend line, currently around 4,950", and indeed, the S&P 500 did just that, briefly dipping below that line. The previous highs and lows from January acted as support levels around 4,900, leading to a rally, but yesterday, the index came back below 5,000, as we can see on the daily chart.
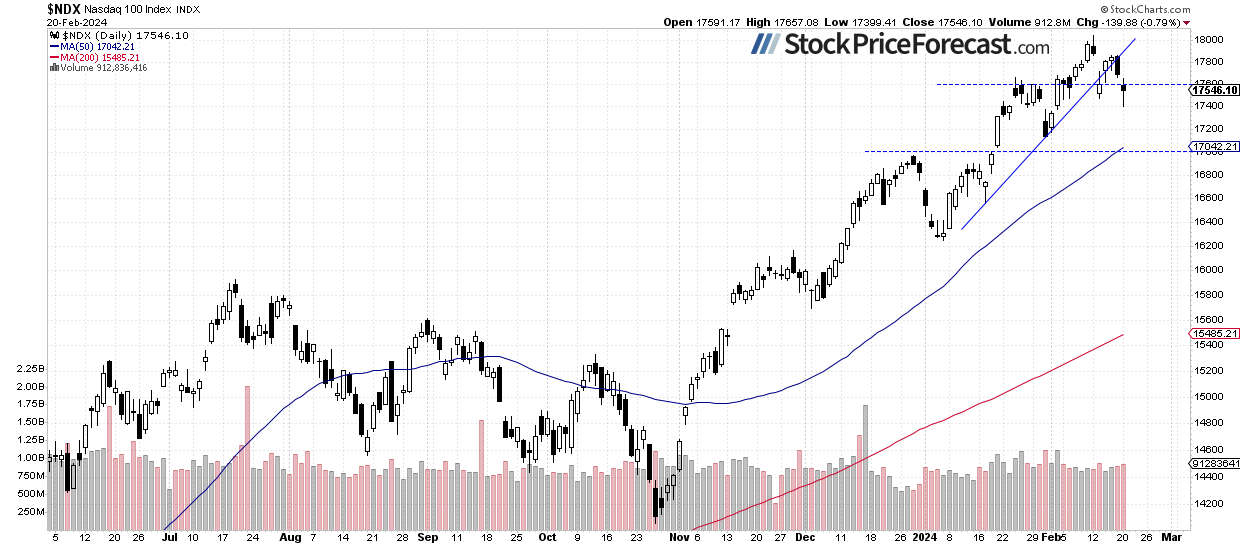
Nasdaq 100 Remains Relatively Weaker
Last Monday, the technology-focused Nasdaq 100 index reached a new all-time high at 18,041.45, but by Tuesday, it sold off below the 17,500 level. In the subsequent days, it began retracing the decline, but on Friday, the tech stocks' gauge reversed lower again. Yesterday, it dipped below 17,500; however, it closed off its daily lows.
Recently, it has been relatively weaker than the broader stock market, but last week, it caught up with the S&P 500 index. However, Nasdaq’s rally was led by a handful of “FANG” stocks like META (NASDAQ:META), NVDA and MSFT. On the previous Wednesday, I wrote about the NYSE FANG+ index.
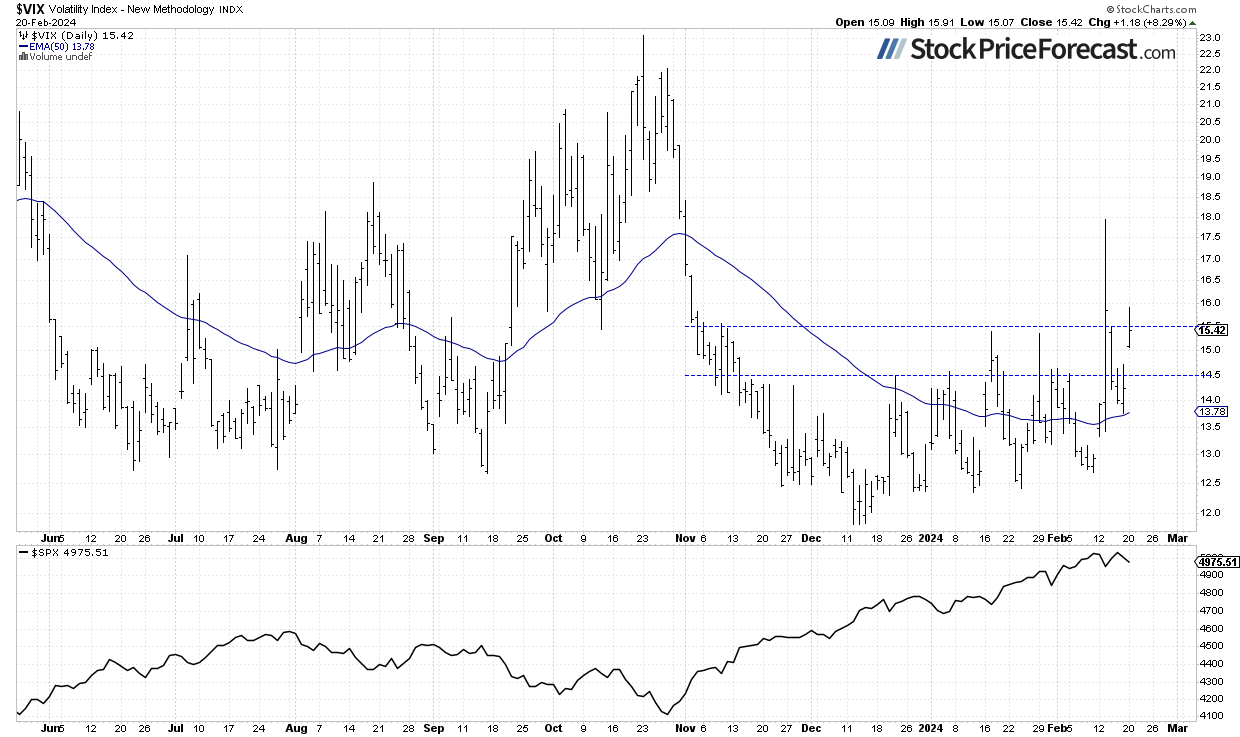
VIX – Extending Consolidation
The VIX index, also known as the fear gauge, is derived from option prices. Last Tuesday, it broke above the previous local highs of around 15.00-15.50, peaking at 18 before retracing towards 14 as stocks bounced back. Yesterday, it climbed again, closing at its highest level since November amid renewed market correction fears.
Historically, a dropping VIX indicates less fear in the market, and rising VIX accompanies stock market downturns. However, the lower the VIX, the higher the probability of the market’s downward reversal.
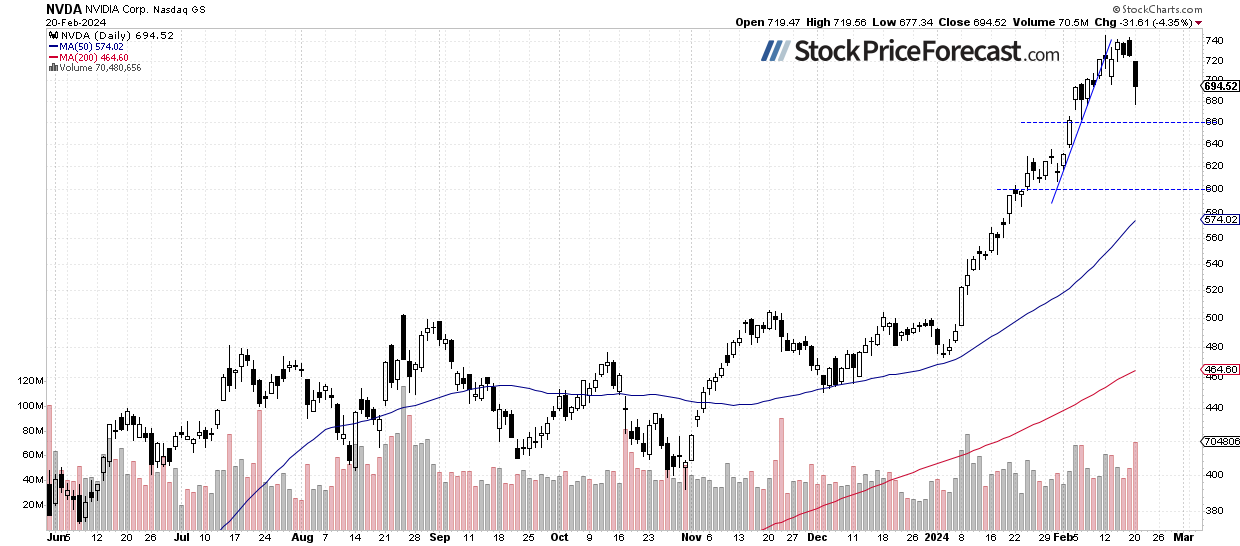
Nvidia (NASDAQ:NVDA) Ahead of Earnings
After today's session, the market will receive Nvidia's quarterly report, crucial for the hot AI sector. Yesterday, the stock retraced a part of its recent rally; however, it remains significantly elevated following an almost hyperbolic rally from its early January low of $473.20. If the market continues downward, key support levels to monitor are $600 and $660.
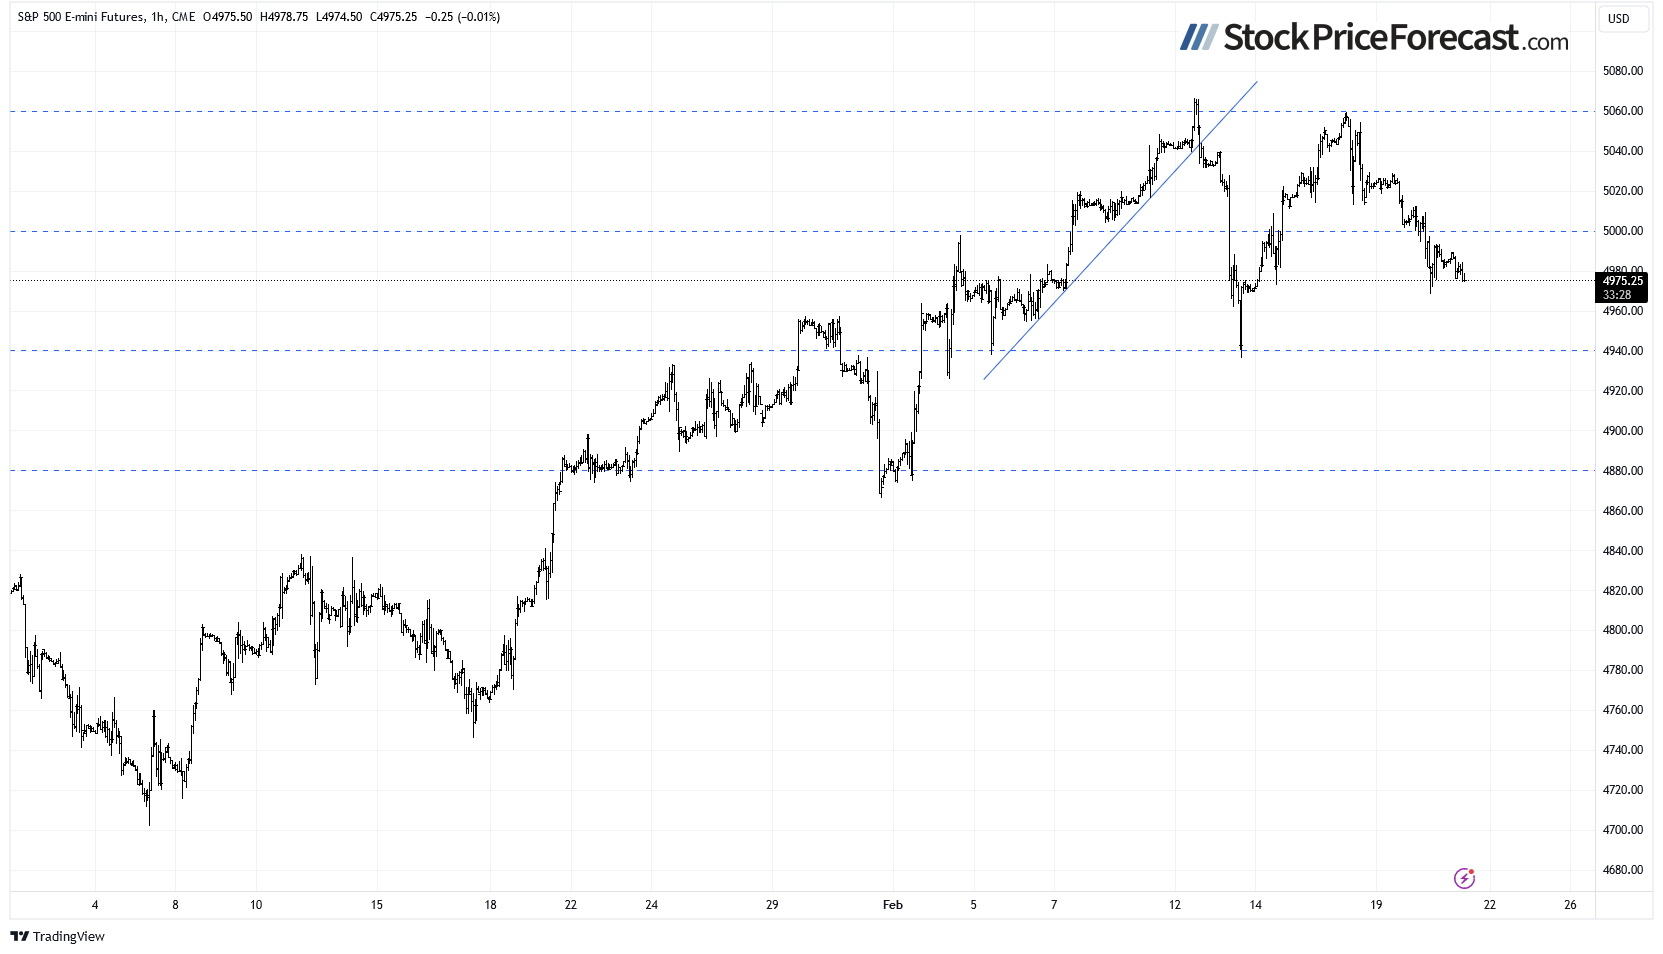
Futures Contract Fell Below 5,000
Let’s take a look at the hourly chart of the S&P 500 futures contract. Last week, the market rebounded from Tuesday's local low of around 4,940, reached after the CPI release. However, this bounce was short-lived, as Friday's PPI release caused the market to retreat from its local high of around 5,060. The resistance level remains at around 5,040-5,060. Yesterday, the market broke below the 5,000 level, and the nearest important support level is now at 4,940 again.
Conclusion
The recent trading action was very bullish, with some of the tech stocks rallying to new record highs, the S&P 500 index breaking above 5,000, and the Nasdaq 100 index getting close to 18,000. In my last Tuesday's analysis, I noted that, “in the short term, the possibility of a downward correction cannot be overlooked. A quick glance at the chart reveals that the S&P 500 index has recently become more volatile.”. Indeed, the correction occurred pretty fast, with the inflation number contributing to the downturn. However, the market quickly retraced the decline in the following days. Friday’s session showed that not everything points to new record highs, and the market may experience some more uncertainty and consolidation. Yesterday, the index extended a short-term correction.
This morning, the S&P is likely to open 0.3% lower, further extending its short-term decline. The index will likely fluctuate around support and resistance levels as investors seek to capitalize on profits following the rally from last year's late October low. Today, investors are eyeing Nvidia's quarterly earnings, which could spur volatility in after-hours trading.
For now, my short-term outlook remains neutral.
Here’s the breakdown:
- The S&P 500 is likely to retrace more of its advances from last Tuesday’s local low.
- A longer consolidation phase may ensue, following an extended rally over the past months.
- In my opinion, the short-term outlook is neutral.