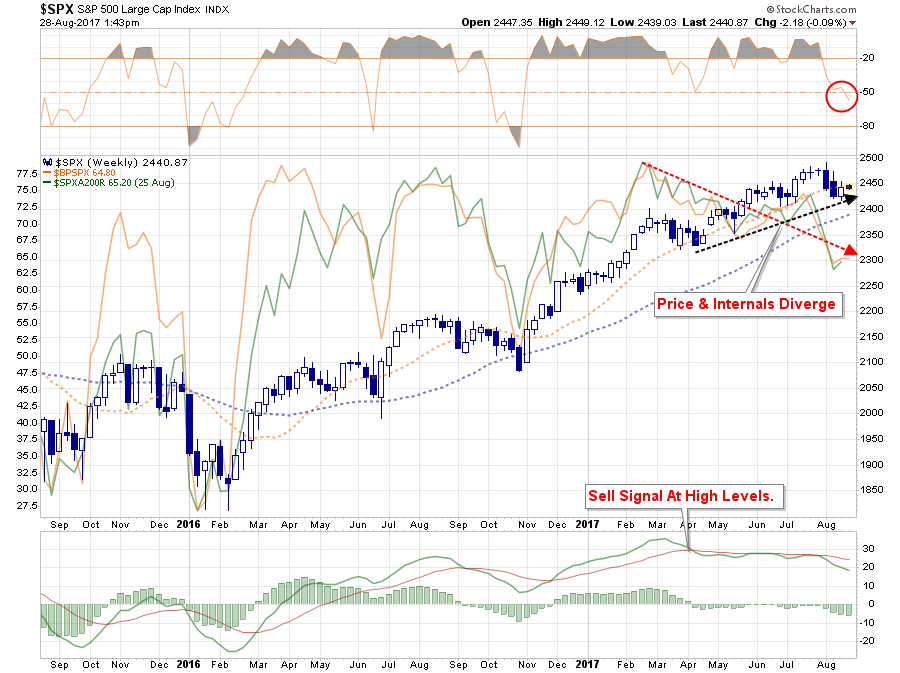
The S&P 500 has now confirmed a weekly “sell signal” at a very high level, which has historically suggested any further price gains will be both volatile and limited until it is reversed.
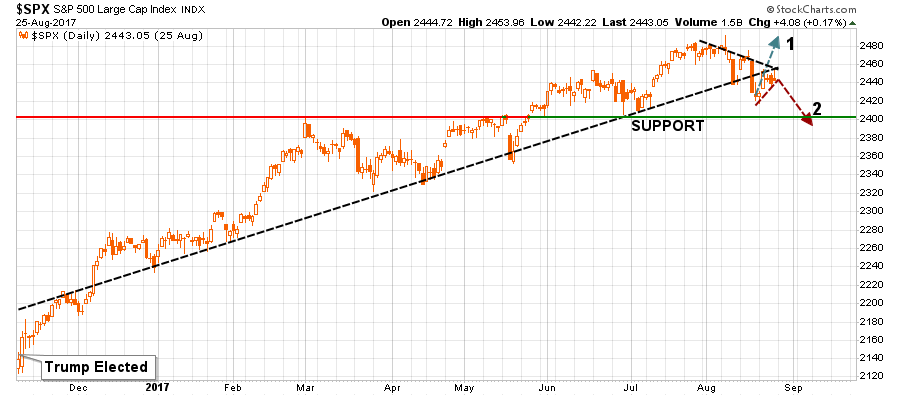
With the bullish uptrend from the beginning of 2016 now broken, that line now becomes overhead resistance. Fortunately, there is some psychological support not far below at 2400 and just slightly below that at the longer-term moving average of 2390.
A break below 2390 and things are likely to get ugly pretty quickly with prices falling back to the previous 2015 highs of 2134. Such would be a correction, from current levels, of 12%.
Before you start scoffing at the notion, a correction of 10-12% is well within the confines of a “normal” correction within any given year historically speaking. However, given the length of time the markets have gone without such a correction, one of such a magnitude will feel far worse.
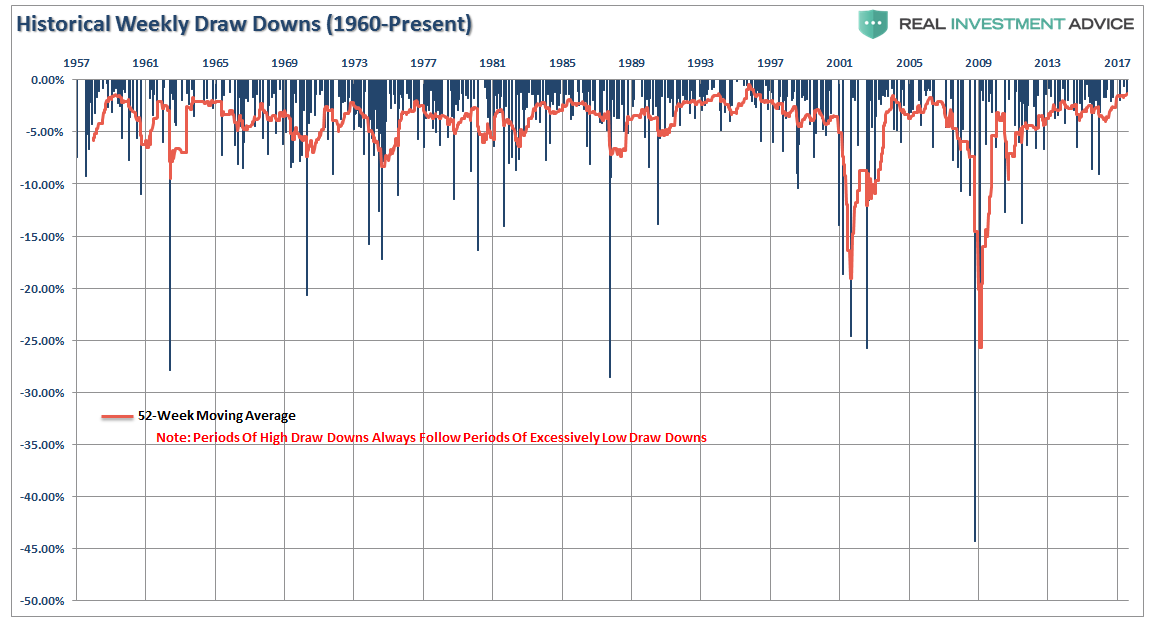
The recent spate of low volatility, and lack of draw downs has pushed the 52-week rolling moving average to one of its lowest levels in history. Periods of much higher volatility have ALWAYS followed. Forewarned is forearmed.
Furthermore, the number of stocks on “bullish buy signals” (orange line) and the number of stocks trading above their 200-dma (green line) are still showing deterioration. Again, while this does not mean the markets are about to crash, it does suggest the current corrective process is likely not complete.
This analysis continues to support my current thesis of a deeper correction over the next month as previously discussed as “scenario 2:” To wit:
Scenario 2:
The market rallies to the upwardly sloping “bullish trend line” that began with the election of President Trump. The rally fails at resistance and turns lower. Such a failure would confirm the current short-term bullish trend has likely concluded leading to a reduction of equity exposure, increases in cash positions and fixed income, and a reduction in overall portfolio equity risk.
The good news, as stated above and shown again below, is on a VERY short-term basis, the markets are oversold enough to garner a bounce.
Such a bounce will likely be an opportunity to shore up risk in portfolios under the guidelines laid out over the last two weeks and summarized below:
Based on the current backdrop, I continue to recommend, again this week, that investors should take some actions in rebalancing portfolio risks accordingly.
- Tighten up stop-loss levels to current support levels for each position.
- Hedge portfolios against major market declines.
- Take profits in positions that have been big winners
- Sell laggards and losers
- Raise cash and rebalance portfolios to target weightings.
This doesn’t mean “sell everything” and run into cash. It simply means pay attention to your exposure and have a plan in place in case something goes wrong.
While the overall bullish trend remains positive, which keeps our portfolios allocated toward equity risk, the deterioration of the primary supports of the market remain concerning. While warnings are just that, a warning, let me repeat that it does suggest a bigger correction may be in the works in the next month or so.
If the market can regain its bullish trend and break out to new highs as we have done repeatedly in the past, increase equity risk in portfolios.
However, until the threat of a more meaningful decline is substantially reduced in the near-term, we are willing to sacrifice a small amount of performance in exchange for the protection of investment capital. Stops have been raised to trailing support levels and we continue to look for ways to “de-risk” portfolios at this late stage of a bull-market advance.
We remain invested but are becoming highly concerned about the underlying risk.


