Get 40% Off
💰 Buffett reveals a $6.7B stake in Chubb. Copy the full portfolio for FREE with InvestingPro’s Stock Ideas toolCopy Portfolios

S&P 500 Signals Cleared Up – And They Lean Bullish

Published 05/07/2020, 11:44 AM
XAU/USD
-
US500
-
SPY
-
GC
-
HG
-
ADP
-
GLD
-

Yes, it has been only yesterday when we talked about the mixed signals stocks were sending out. Given yesterday’s surprise finish to their intraday resiliency, it might seem misplaced to interpret those hints as bullish. Yet, that’s exactly what has happened, and the following analysis will thoroughly cast light on all the whys.

S&P 500 in the Short-Run

We’ll start with the daily chart analysis (charts courtesy of http://stockcharts.com ):

Starting off with the sizable upper knot of Tuesday’s candle, the bulls suffered rejection of higher prices as they raced off the 50% Fibonacci retracement rendezvous on Monday. On the fundamental news front, all eyes were yesterday on the ADP employment data. Whichever way you look at it, losing more than 20 million jobs over a month is plain horrible. We expected the market to sell off on the news – and it indeed initially do that by erasing the opening bullish gap and diving below yesterday’s closing prices.

Hand-in-hand, we looked for the debt markets to decline. Just as the S&P (NYSE:SPY) 500, high yield corporate bonds (HYG ETF) also opened higher and kept sliding in confirmation of the developing S&P 500 downswing. Yet ,as they caught a bid just below $79, they stabilized and attempted to rebound, taking stocks predictably along. That was the moment we deemed our short position no longer warranted, closed it and actually entered a long one.

This is how we have justified the action in one of our yesterday’s intraday Stock Trading Alert:

3rd party Ad. Not an offer or recommendation by Investing.com. See disclosure here or remove ads .

High yield corporate debt (HYG ETF) retested the daily lows below $79, and it appears they’re holding. Notably, the local lows support is at $78 – a full dollar lower. Looking at the sensitivity of stocks moving in lockstep with the instrument, that would translate into quite many points before we could talk of an outlook determinant (HYG ETF holding above support with each preceding intraday downswing fizzling out) having changed.

Monday’s intraday HYG ETF low was $78.20, and the S&P 500 low was 2771. For sure, seeing corporate bonds dive well below $79 wouldn’t be a happy sight, but it’s not unimaginable in the short run – especially given the key Friday’s jobs data (these are more important than tomorrow’s unemployment claims). Yet, stocks haven’t tumbled on today’s figures – technology is up, healthcare refused to decline, and the volume behind declining energy, materials and industrials, will likely remain below yesterday’s levels, which would take away from the bearish implications.

So, despite financials being close to their intraday lows (at $21.47), the sectoral outlook isn’t disastrous in any way. Judgmentally, what was the strongest headline driving stocks lower at the start of the week? Trump playing the China tensions card. Stocks are listening to it more than to coronavirus and its job market or other implications.

Thus, it makes sense to interpret market action in light of the magnitude of reactions tounfavorable news and the time that has passed since. Especially after holding up this well against today’s ADP (NASDAQ:ADP) figures. Bluntly speaking, it’s like "throw at me whatever you want, I’ll recover shortly."

3rd party Ad. Not an offer or recommendation by Investing.com. See disclosure here or remove ads .

And we don’t know when the next hit will come. Will it be chart-driven, or a headline one?

Unless it breaks the back of the HYG ETF (its support, that is), it doesn’t change the outlook for stocks.

The above tendency of the S&P 500 to prove resilient almost no matter what, was clearly more than worthy of consideration. And then the Trump statement expressing doubts whether China would live up to its commitments under the trade deal, came. Given the above-expressed sensitivity to the U.S.–China trade relations, stocks understandably took a dive in the final 30 minutes of trading, across its many sectors and with deterioration seen in the HYG ETF as well.

It would be easy to jump to conclusions and cry that the sky is falling – but would that be justified? As they say, don’t throw the baby out with the bathwater.

The measured way of dealing with such a curveball would be to ask whether the outlook has changed. And as we’ll further see, no – it hasn’t changed, and actually presented us with bullish signs.

But first things first. Stocks are headline-sensitive – we get that. Yet, we articulated our opinion that stock bulls would just dust themselves off and recover – and do so still in today’s overnight session.

And that’s exactly what has happened, by the way. Stocks found a floor and peeked higher even before the strong China export data came in. We’ve also seen the stock futures recovery to continue during the European morning hours.

3rd party Ad. Not an offer or recommendation by Investing.com. See disclosure here or remove ads .

What is the lesson here?

As for each and every trade, it’s to interpret the signals in their entirety – that’s the only way to get odds in your favor as much as reasonably possible. As for trading performance over the long run, it’s to dutifully and attentively listen to the market’s many messages on a daily basis – with an open and flexible mind. It’s only over a long enough period of time and with sufficiently large a trade sample collection, that you see the edge you’re working with bring fruits. Christmas doesn’t come regularly in trading, and it would be foolish to jump out of the window because of any single trade.

Coupled with a money management lesson, you must give the edge enough breathing space to work its magic, and risk only as much (or even better, as little) so as to mount the next trade where the odds are again in your favor. And after that, the next one – regardless of the preceding day‘s result. And so on – trading is a marathon, not a sprint.

All right, let’s continue with the S&P 500 assessment and dive into the credit markets next.

The Credit Markets’ Point of View

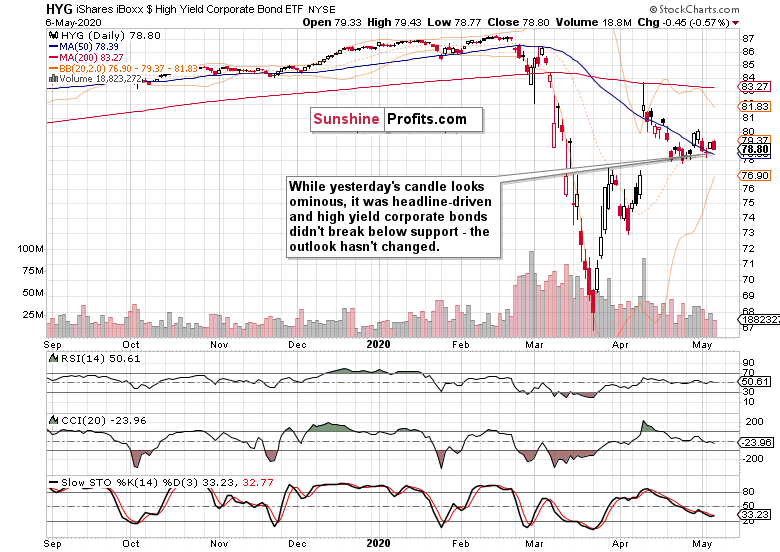
We’ve already discussed how well the high yield corporate debt held up in the aftermath of yesterday’s horrific private payrolls data. Again, the slide below $79 happened in the last 30 minutes of trading, giving us a sizable daily red candle.

But has the HYG ETF outlook changed? It could have broken much lower both early in the session, and towards its end – yet it didn’t. Just as in the Sherlock Holmes story “The Adventure of Silver Blaze,” pay attention to the dog that didn’t bark. And junk corporate bonds aren’t screaming that the sky is falling. Should they break below their recent lows, that would be a different cup of tea entirely.

3rd party Ad. Not an offer or recommendation by Investing.com. See disclosure here or remove ads .

Let’s proceed with sectoral analysis and key ratios. The messages are worth their weight in gold.

Key S&P 500 Sectors and Ratios in Focus

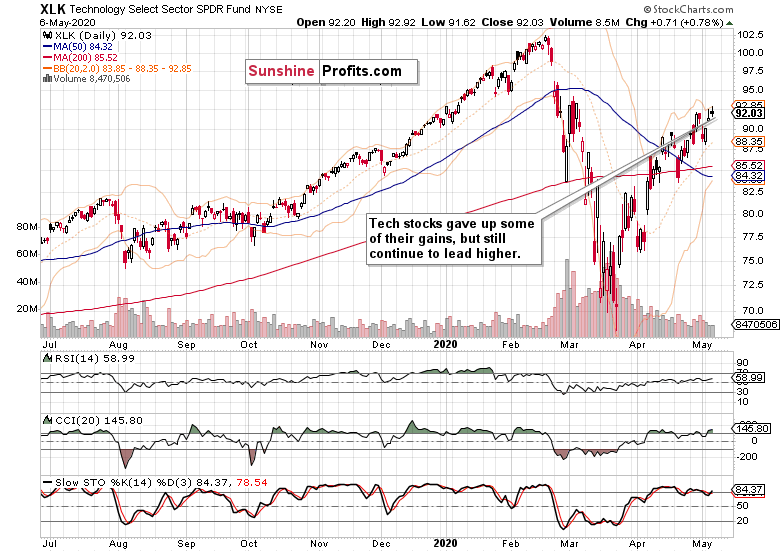
The tech sector opened higher, erased the ADP-driven downswing attempt, and only retreated in the final 30 minutes of trading. And again, this was a sight to see across many S&P 500 sectors. Still, it closed higher, which means that its leadership in the upswing-uphill battle remains intact.

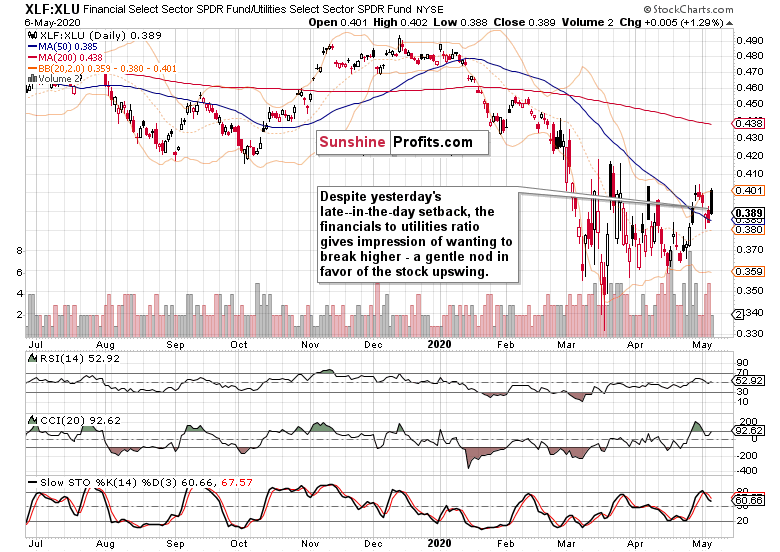
Do you see how high the financials to utilities ratio (XLF:XLU) opened yesterday?

Despite the setback, the ratio is making higher lows and trading with an increasingly bullish bias. This bodes well for higher stock prices ahead.

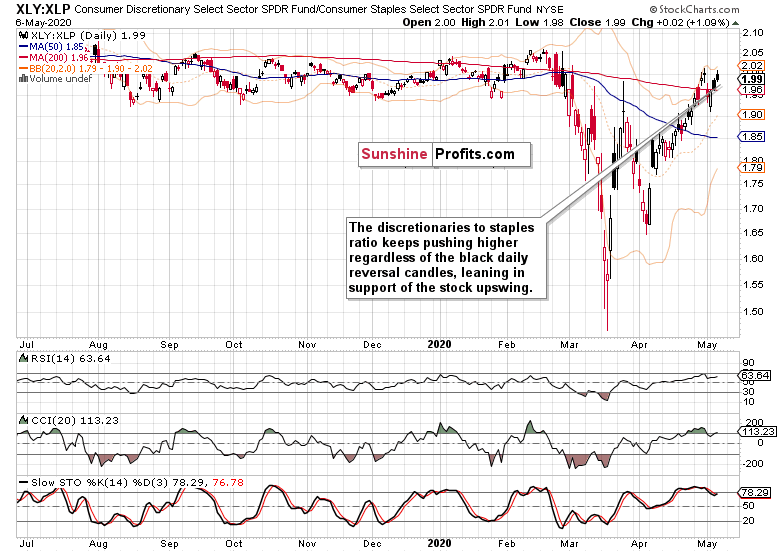
Consumer discretionaries to consumer staples ratio (XLY:XLP) is another leading indicator for stocks. It’s moving up as well, speaking not so softly in favor of the stock upswing.

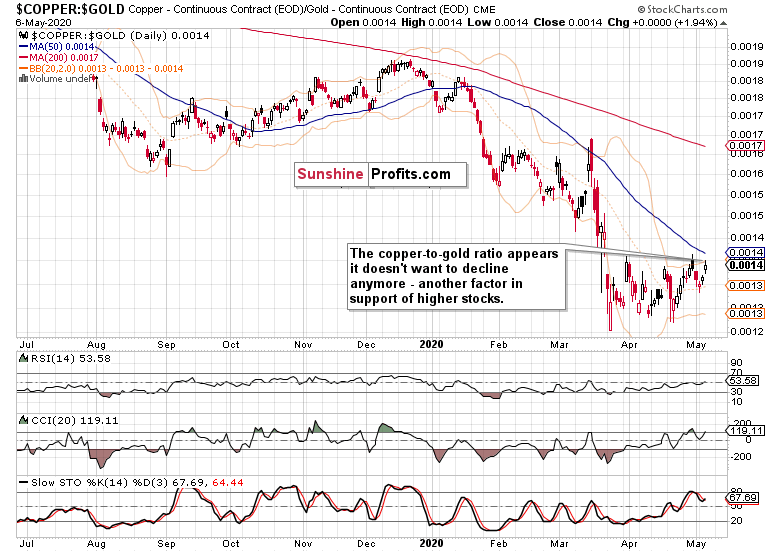
The metal with a PhD in economics closed higher compared to gold, as well pointing to the bullish spirits returning. If you look at the above three ratios, it’s apparent what we mean by the clear bullish signals. Regardless of yesterday’s China-headline-driven downswing, all the three leading indicators have taken the setback in their stride. That’s what has given us increased confidence that the S&P 500 would rise like a phoenix in today‘s overnight session before you could say Jack Robinson.

And whatever today’s unemployment claims figure, it remains likely for the above reasons, that the stock index would just shake it off.

Summary

Summing up, stocks proved resilient in the face of grim employment data, and the key corporate credit market has held up well through the day. Seeing that coupled with the sectoral performance, has shifted our bias from short to long. The bullish outlook is supported by the leading ratios’ performance, which goes to confirm the steadfast recovery from yesterday’s Trump doubts regarding the China trade deal. The bulls
certainly appear in the mood to keep climbing the wall of worry again, and our long position remains justified.

3rd party Ad. Not an offer or recommendation by Investing.com. See disclosure here or remove ads .

Latest comments

Today's (that is Friday) article is online here now - enjoy.
Wishing a nice weekend to everyone!
your nice 🌹
"Proving Resilient" is clearly not what one would expect in an environment such as this, is it.  Stocks are meant to reflect value, now that they have become completely separated from that which we use to measure value by, they are worthless and the market is just a big ponzi scheme.  Government money, our tax dollars, and the tax dollars of our children's children is being used to prop up a prop.   good luck with that.
  - Some should not be resilient.   Perhaps you can just publish what ETF's the government is buying into, how much they are spending and how often, it should be public information as it is our tax dollars creating the resiliency after all.  Or better yet, let's just ask the government to put the money into each of our accounts directly and we can forgo pretending to trade and "take risk" altogether.
;-)
 Technical analysis works, and that's my field where I'm committed to bring you value. I give the interventions their due attention in the Alerts and also in the articles you see. While the Fed is the biggest players, they're not the only one. Your Congressman  /Congresswoman or the Fed itself will surely give you you all the detailed breakdowns you're after ;)
very bad article,all your imaginatio,the fact is it will move opposit of u
In my Friday's article, I have not interpreted charts with Thursday's closing prices any more bullishly because of pre-Friday overnight action. The above Thursday's article is as bullish as it gets already, and prior to any Friday premarket action happening at all. Each of my daily articles reflects the market setup going into the new trading day. Subscribers and readers want to benefit while they can act on the insights presented. It's my responsibility to present the momentary picture in its entirety - and I do discuss premarket action in the daily articles if it is warranted and if it changes the outlook at closing prices. It did not, and as the market going into Friday validated my early Thursday's points already, I didn't feel the need to pat myself on the back in Friday's article.
What I strongly felt needed to clarify, was that your point, after reading my Thursday's article and before Friday's article was born, made it sound like Friday's premarket action somehow validated my Thursday's decision to keep Wednesday's long position open. I can't travel back in time, and each of the Alerts on my home site reflects the full real-time market situation and decision at the time of publishing. If I am long on Thursday, I remain so on Friday too, unless take-profit or stop-loss gets hit (only subscribers see these levels and updates thereof). Which means that I deal with the overnight action just as everyone else - I just work with the US regular session data, update subscribers if needed before the closing bell, and then I wake up to the overnight session and either the position is intact, or it has been automatically closed if no trailing waiting orders have been used.
One more thing I know you're aware of. There is the regular session with heavy trading volume and data announcements, which carries a certain, priceless weight. In overnight sessions, the volumes are simply different. Signing off, thanks for your curiosity - just as I love to deliver a great, insightful service that aids in the success of others, I take pleasure in answering questions. Wishing you a great weekend!
Another great article, thank you!
Charts mean absolutly nothing in this market!
yeap for these few months. follow chart will die faster. that is why she change her camp from being a bear. she got burn badly the last 2 weeks.
Nothing will ever fail again except the dollar itself.  Fed buys: REITs bonds, business' bonds, ETFs, treasuries, t-bills, overnight lending (repo), food from farmers, Tesla stocks and etc. Nothing will fail, the only thing that can fail now is the dollar itself. Markets will keep going up and only UP with some dips along the way. When currency is created out of thin air then there is nowhere else to put it but into the markets. When Venezuela's economy failed their stock market reached all time high records.
Yesterday your bearish positions were justified, today your bullish position are justified. I cannot follow are you buying or selling?
haha
it's hard to write something new every day, by the way I appreciate
Well, it's at length explained why the switch from bearish outlook to bullish one was warranted. Please look at the intraday Stock Trading Alert quotation part and below, it's there in the plain open. If I write "long position is justified", I'm obviously long, if I write "short position is justified", I'm obviously short, if I write "no position is justified", I'm out of the market - it's within the intraday Alerts at my home site where these changes are fully explained - just as in the Wednesday's one that you saw quoted in the very next article for investing.com
Do you wake up saying Bull in the middle of the night?
oh great, we're finally going to be bullish then? >D
"If you see only one side of the story, that is the only side you will ever see" This is exactly what it is about this article.
Thanks Monica! Great analysis as always. Your insight of using credit markets and the relative strengths of different sectors to assess bullish/bearish sentiment is the best way I've encountered so far of seeing the true sentiment behind what the indexes are doing. Your analyses are much appreciated!
Thank you very much! Your praise is another commitment to keep delivering
market seems more sideways than bullish, and Monica seems like a daytrader
es and ym have been sideways cause people were rotating into all tech nq has been up ... now that enough people are pulling the train through tech other money are starting to buy the rest of the market so es will rise on the back of earnings and fomo but how long it will last is another question .. as long as the virus news is positive the markets will continue to rise.... everything else is expected to work out as long as the virus stays in check
It's not very decent of you to post your article some hours after you have seen the current session and all the overnight action...
If you check the time stamps of the Alerts on my home site, you'll see that I manage to prepare these articles usually slightly before or at the US market open. I cannot influence in any way when the submitted articles get republished here, but they're out of my way and about to reach you within minutes of the subscriber-only editions. The fact that you raise my supposed advantage of seeing the current session just goes to show the extent of my pre-US open analysis being in line with what is likely to happen next. Also, please consider the daily research, dozens of charts I go through, annotate, and present to you as a comprehensive textual analysis - it all takes time, ruling out the scenario you're describing...
The only way you can prove your point is by posting right after market close, not after having seen several hours of futures action after the close.
I always post at the same time of the day, capturing the outlook at the onset of the trading day, and deal with anything newly arising via intraday Stock Trading Alerts. Practically speaking, that's the only workable and realistic way.
Your opinions may be right in the short term but not in the long term.
In the article, I gave the full reasoning why the outlook has changed and why I think we better not count on lower stock values these days. While I perfectly understand the concerns about the long-term (see e.g. my article dating back to Apr 12), it's certainly more fun to ride a profitable position in the short-term already than otherwise. My purpose is to be attuned to the sometimes shifting, sometimes more stable winds of change in the marketplace - and share that knowledge...
You opinion on the market changes more times than trump uses the word tremendous.
Yeah, if you go with her position from yesterday's article you will probably get burned today.  Day late and a dollar short!
 These articles are posted once a day, and you're reading them with a certain delay that doesn't depend on me in any way (comment above). Have you seen how many articles I post for subscribers on my home site? 4 articles a day are no exception - they are about market action in the very now. Yes, it's  within the intraday Alerts there that these position and trade parameter changes are made and fully explained - real-time and actionable.
Risk Disclosure: Trading in financial instruments and/or cryptocurrencies involves high risks including the risk of losing some, or all, of your investment amount, and may not be suitable for all investors. Prices of cryptocurrencies are extremely volatile and may be affected by external factors such as financial, regulatory or political events. Trading on margin increases the financial risks.
Before deciding to trade in financial instrument or cryptocurrencies you should be fully informed of the risks and costs associated with trading the financial markets, carefully consider your investment objectives, level of experience, and risk appetite, and seek professional advice where needed.
Fusion Media would like to remind you that the data contained in this website is not necessarily real-time nor accurate. The data and prices on the website are not necessarily provided by any market or exchange, but may be provided by market makers, and so prices may not be accurate and may differ from the actual price at any given market, meaning prices are indicative and not appropriate for trading purposes. Fusion Media and any provider of the data contained in this website will not accept liability for any loss or damage as a result of your trading, or your reliance on the information contained within this website.
It is prohibited to use, store, reproduce, display, modify, transmit or distribute the data contained in this website without the explicit prior written permission of Fusion Media and/or the data provider. All intellectual property rights are reserved by the providers and/or the exchange providing the data contained in this website.
Fusion Media may be compensated by the advertisers that appear on the website, based on your interaction with the advertisements or advertisers.
© 2007-2024 - Fusion Media Limited. All Rights Reserved.