The earnings per share (EPS) for all S&P 500 companies combined increased again last week to $173.68. The forward EPS has now increased 9.22% since January 1st.
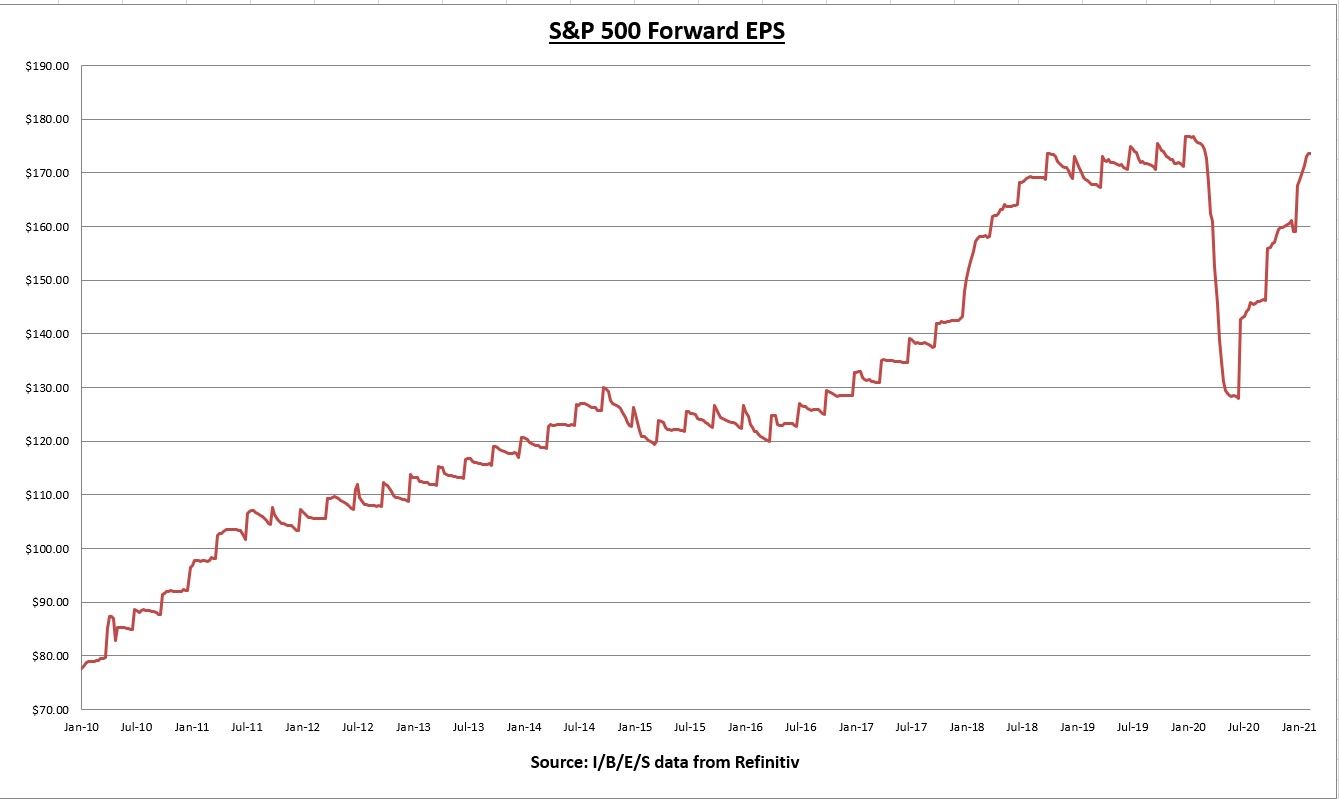
80% of S&P 500 companies have reported Q4 results. 82% of companies have beat expectations and reported earnings a combined 17% above expectations. (I/B/E/S data from Refinitiv)
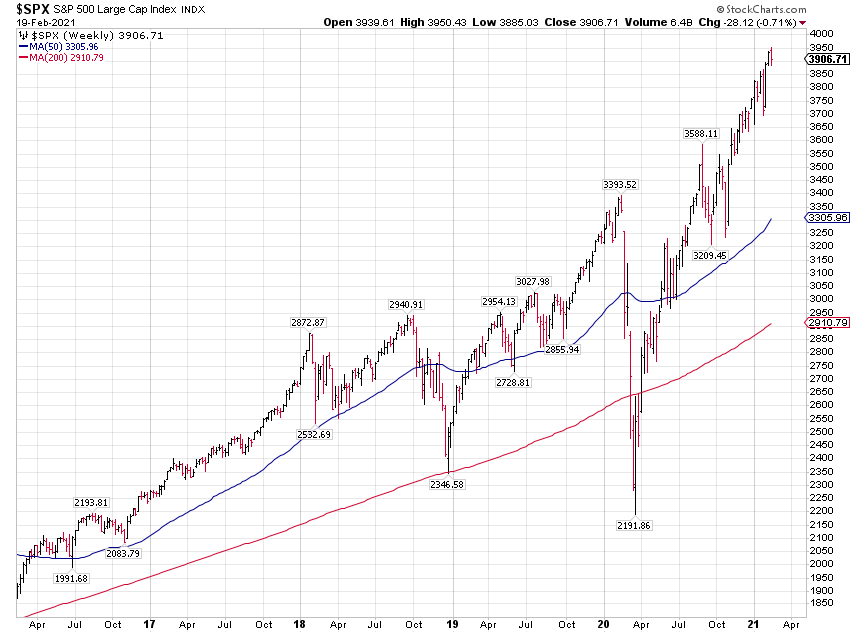
The S&P 500 declined -0.71% for the holiday shortened week.
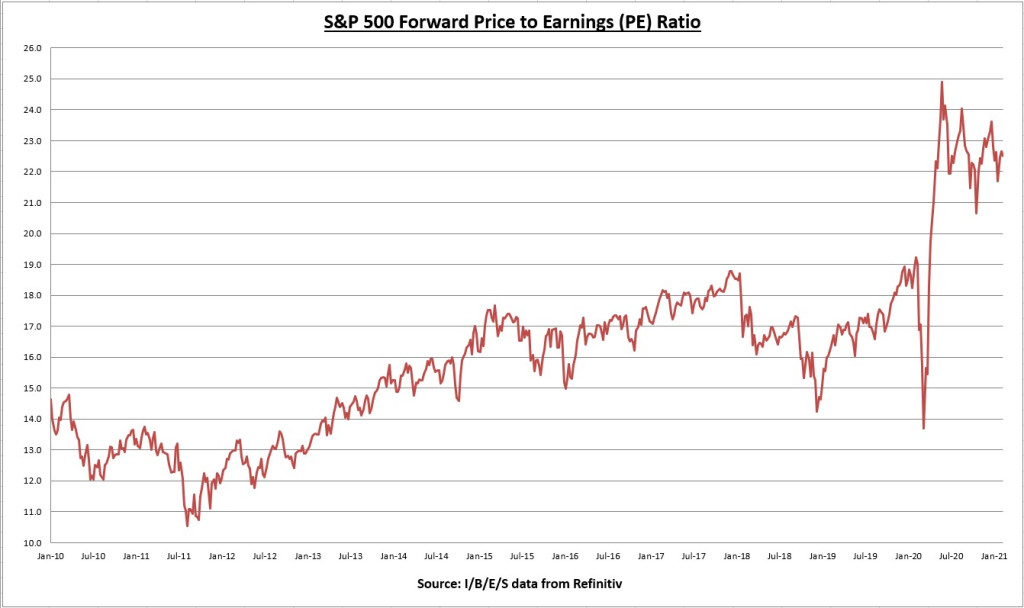
The increase in EPS plus the decline in the S&P 500 brought the price-to-earnings (PE) ratio down slightly to 22.5.
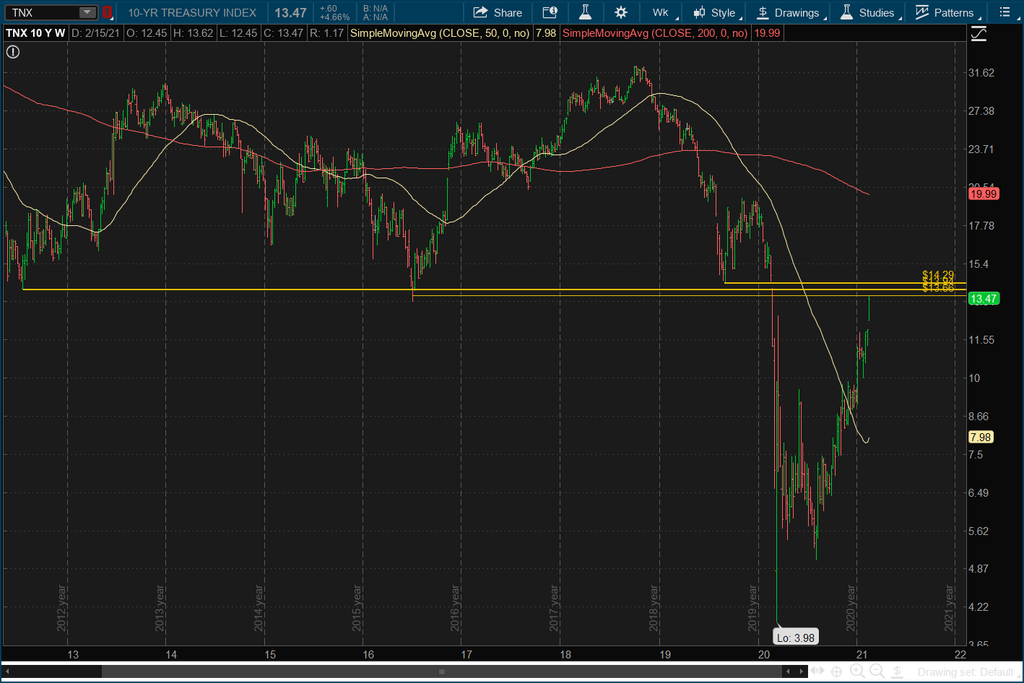
The 10-year Treasury bond rate continues to rally above 1%. The above chart shows the confluence of prior low points in 2012, 2016, and 2019. The confluence zone comes in between 1.366% and 1.429%, which could become resistance at least in the near term.
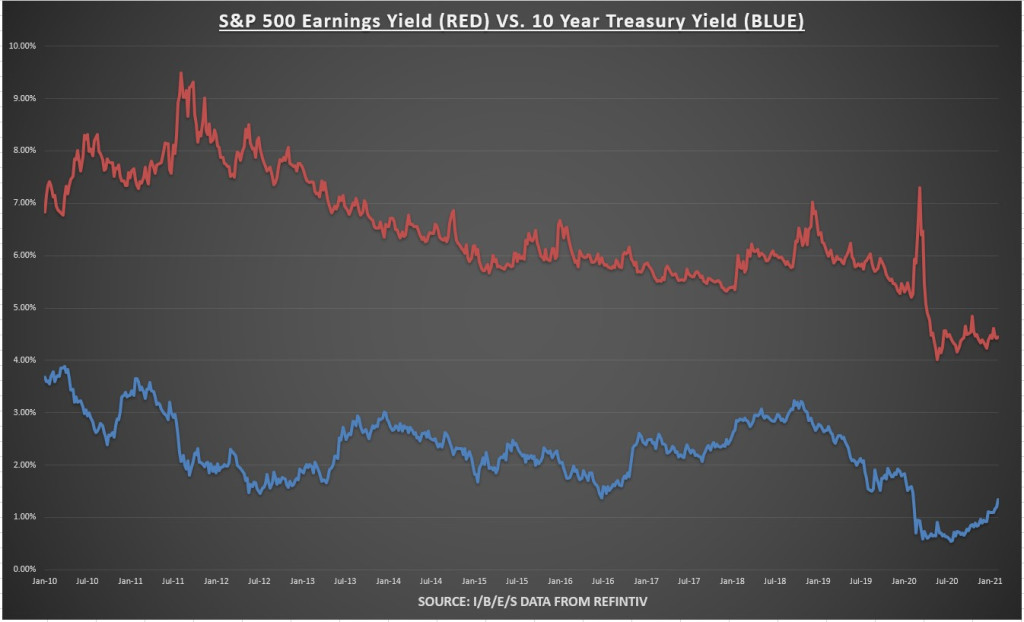
The earnings yield on the S&P 500 is now 4.45%, while the 10-year Treasury bond rate rose to 1.345%.
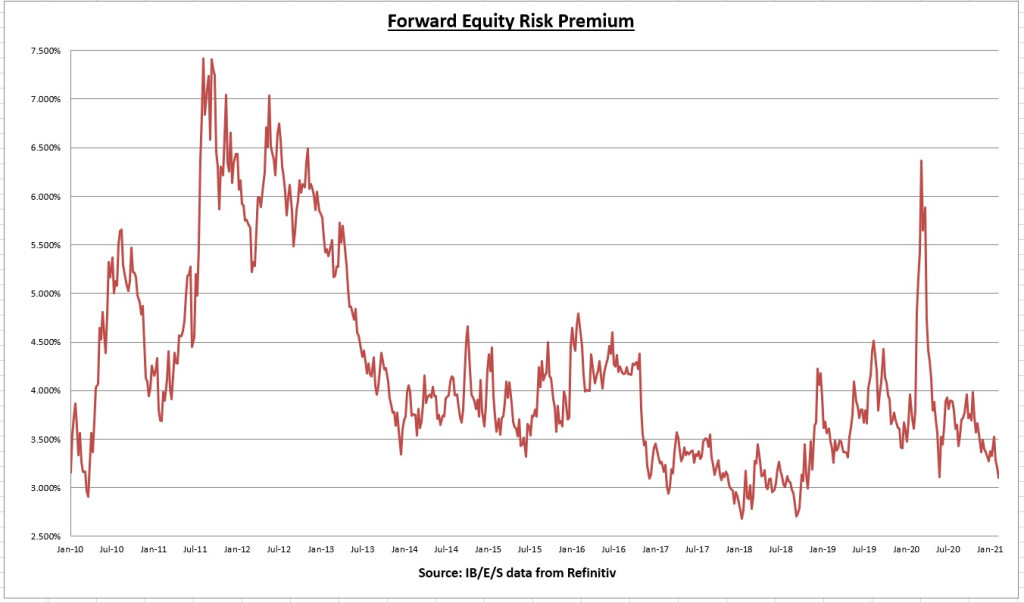
The 10-year Treasury rate increased more than the S&P 500 earnings yield, so the equity risk premium (earnings yield minus 10-year Treasury rate) narrowed to 3.101%.
Economic Data Review
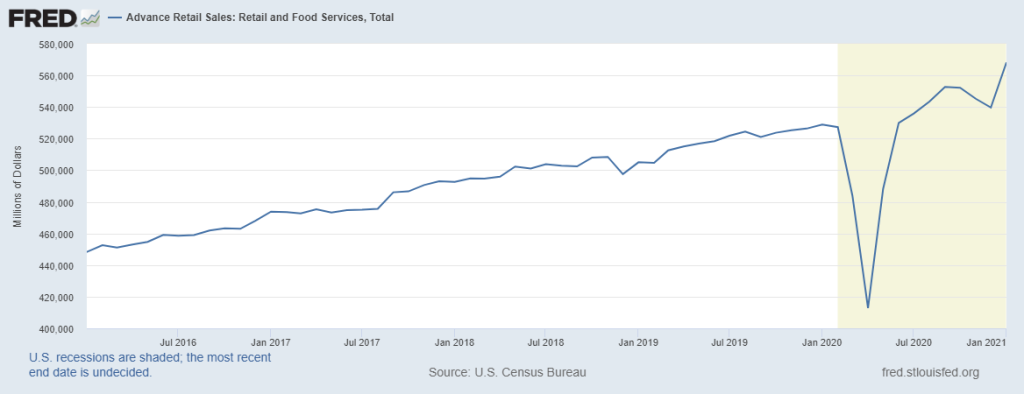
After three straight months of declines, January retail sales handily beat expectations with an increase of +5.3%, a new all time high. Solid growth across all categories, with even bars and restaurant sales showing an increase of +6.9%. Encouraging news.
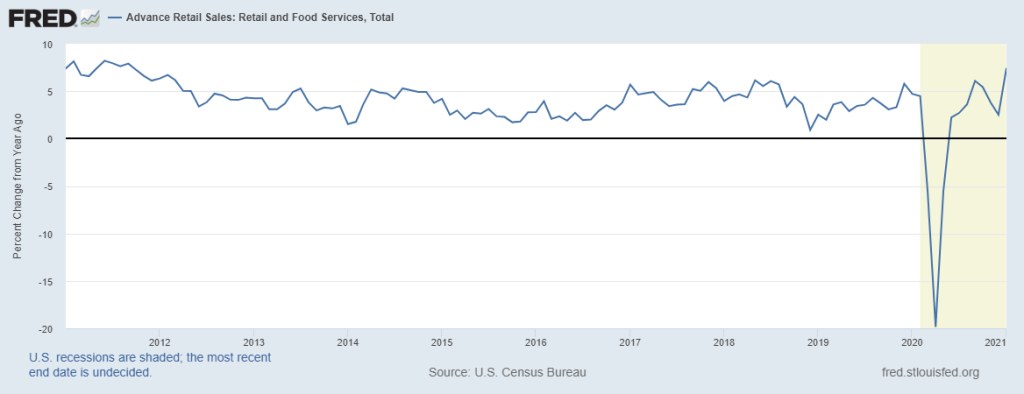
At $568 billion, this represents an increase of 7.43% year-over-year. You have to go back to September 2011 to see a higher annualized growth rate. Clearly, stimulus measures are having an effect.
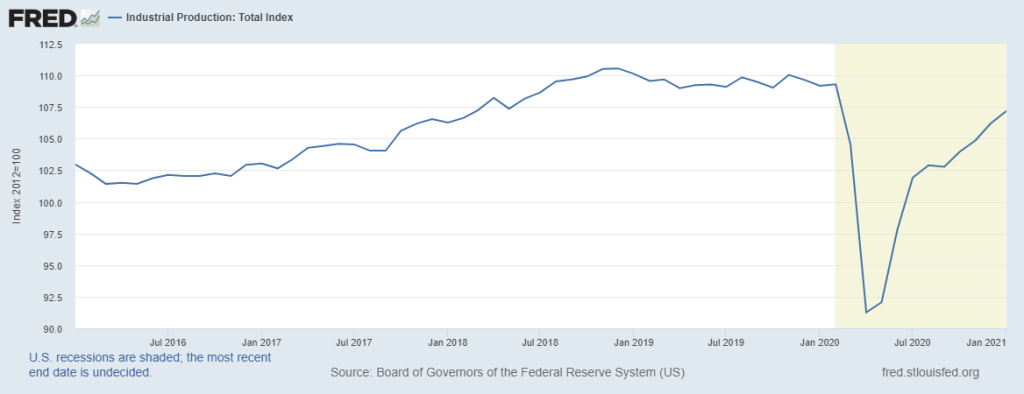
Industrial production increased 0.9% in January. It’s now recovered 88% of the losses during March and April, and 82.5% of the decline from the December 2018 all time high. The index is still down -1.83% on a year-over-year basis, but well off the -16% year over year decline in April.
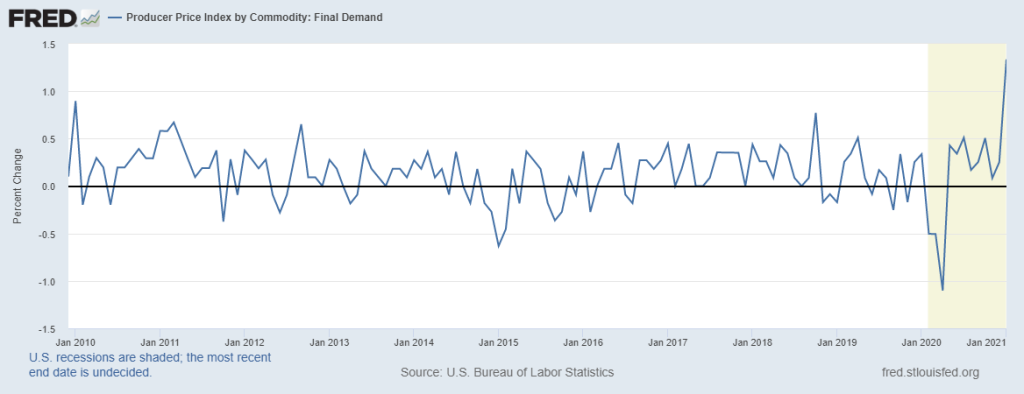
The Producer Price Index rose 1.3% in January. It’s the single biggest monthly increase since the data set inception date of December 2009. Input costs are rising (the first sign of inflation), companies can either accept lower profit margins or pass the costs onto consumers. One month doesn’t make a trend, but its important to watch and it piggybacks off my key theme for later this year (inflation).
Notable Earnings Reports
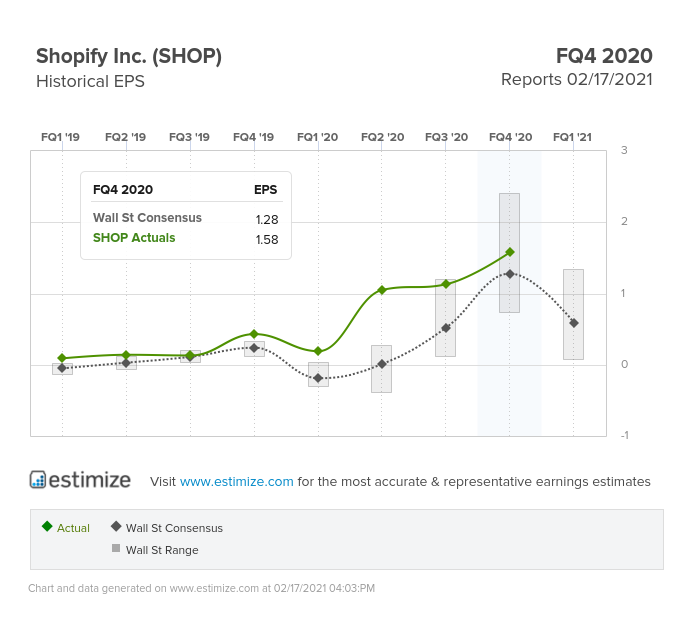
Shopify (NYSE:SHOP) isn’t in the S&P 500 (yet) but its a major player in the ecommerce space that reported record results for 2020. Q4 adjusted EPS beat estimates (+264% y/y growth) and revenues also beat expectations (+94% y/y growth).
Some key points:
- Revenue for all of 2020 grew 86% (with merchant solutions growing +116%)
- Merchant solutions increased from 63.7% of sales in Q4 2019, to 71.4% of total sales in Q4 2020 (profit margins for merchant solutions (41%) are lower than profit margins for subscriptions (79%)
- Gross margins declined from 52.2% to 51.6% (due to an increase in the lower margin merchant solutions segment)
- Operating income swung to a positive $112 million (from an operating loss of $30 million in Q4 2019)
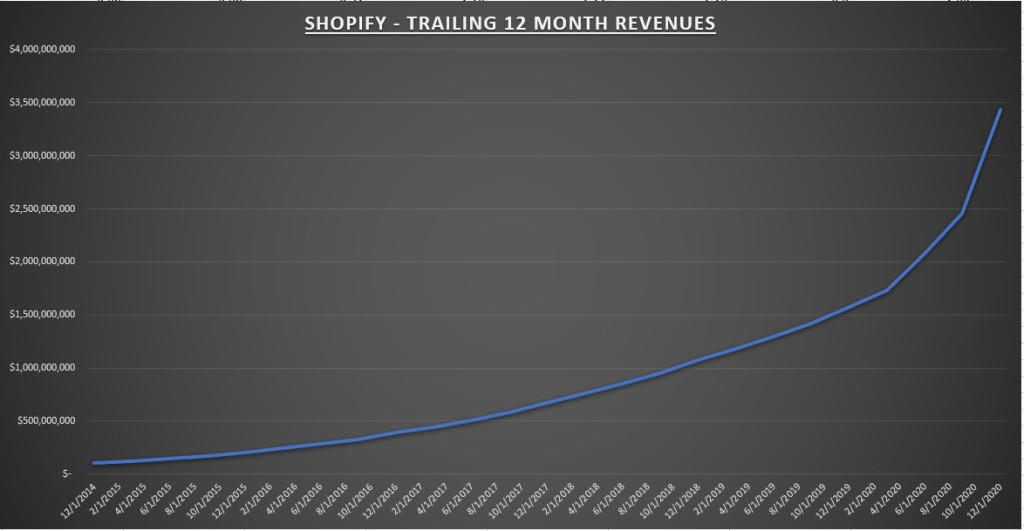
Trailing 12 month revenues for the company show the tremendous results in 2020.
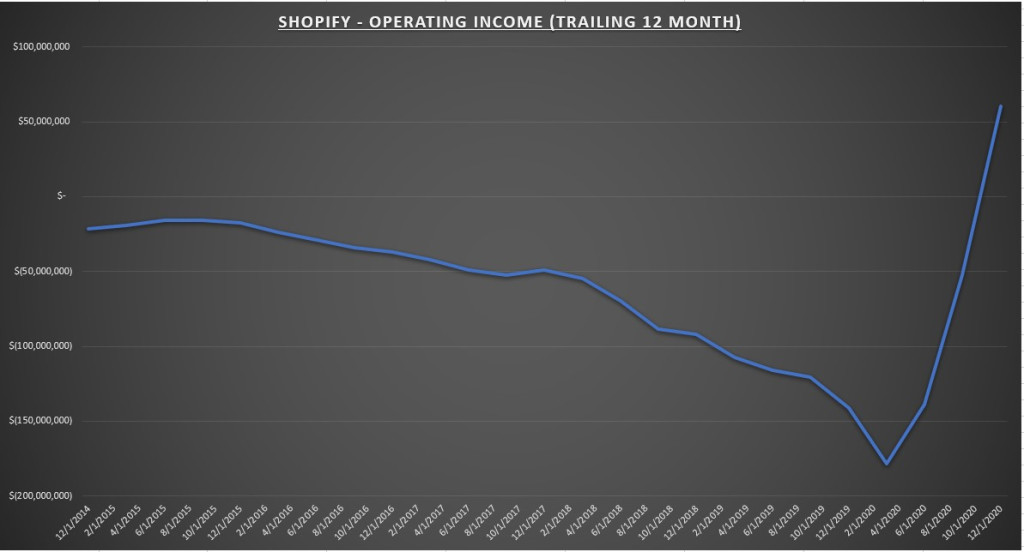
With trailing 12 month operating income turning positive.
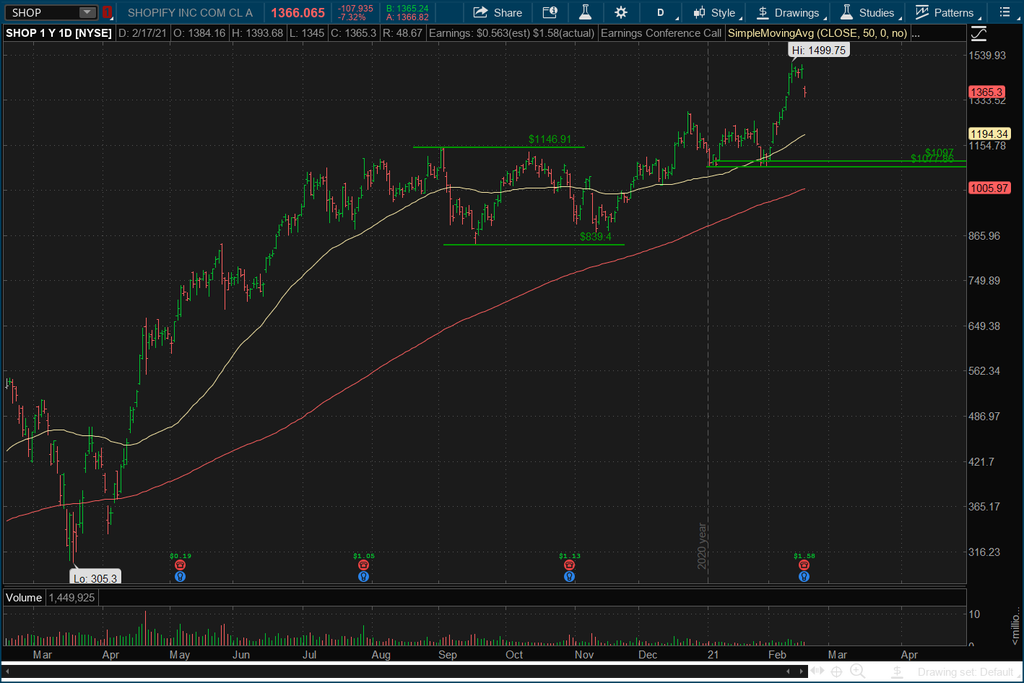
The stock was down about 7% after the announcement. 2020 was a monumental year, which can be a double-edged sword, as it creates tough comparisons for 2021. The company expects the growth rate to slow, but remain above the growth rates prior to 2020.
At this time last year, the stock traded around $300, and now it trades around $1300. Current price to sales is about 73x and forward price to earnings is about 385x. Needless to say, its a pretty expensive stock priced near perfection. It’s a hold for me. I have no intentions to sell, but no plans to buy anywhere near these levels. If we get a shakeout below the $1100 level, that might interest me.
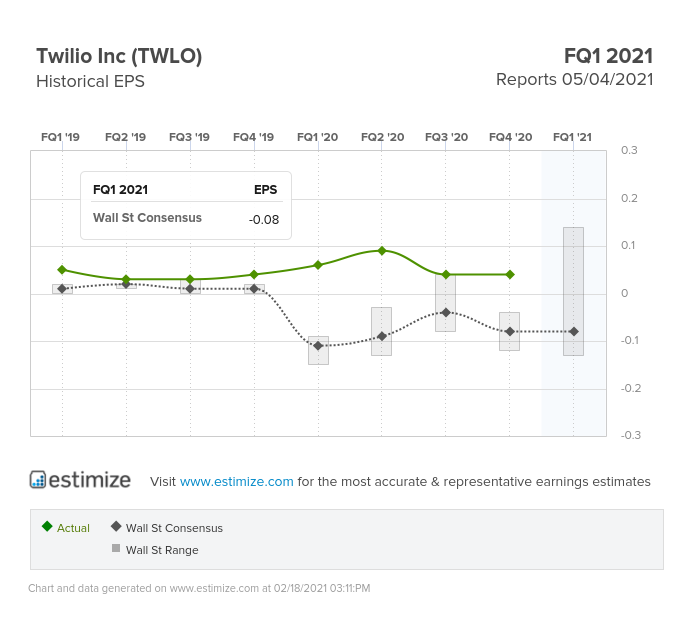
Cloud communications company Twilio (NYSE:TWLO) reported a Q4 earnings beat on revenue growth of 65%. Total revenue growth for all of 2020 came in at 55%.
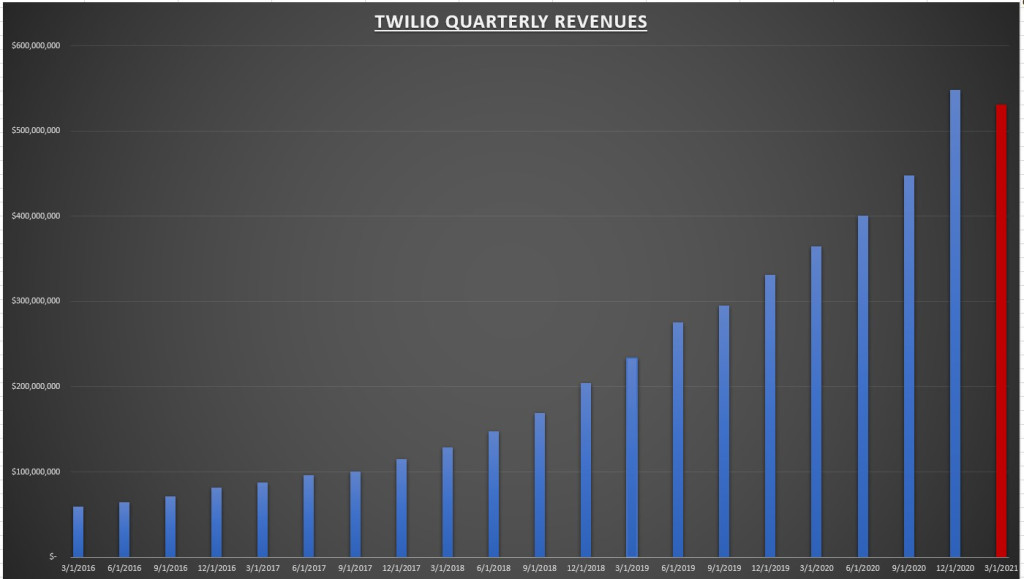
Another record quarter for the company, while their Q1 2021 outlook is for 44% to 47% year-over-year revenue growth (red bar).
Gross margins remained about the same as Q3 2020 (51.5%), but slightly down from Q4 2019 (52.7%). GAAP operating margins declined on both a sequential and year-over-year basis, mainly driven by an increase in 'general & administrative' costs, which went from 15.7% of revenue in Q4 2019, to 23.5% of revenue in Q4 2020.
Adjusted EPS came in at $0.04, while the street was expected a loss of $0.08.
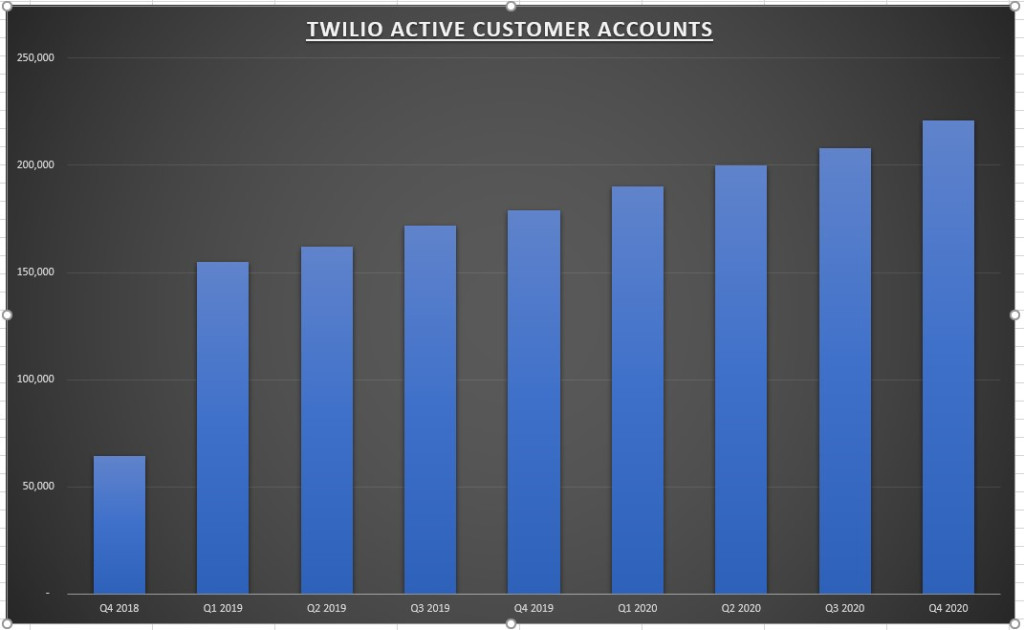
Active customer accounts grew +6% over Q3, and +23.5% over Q4 2019.
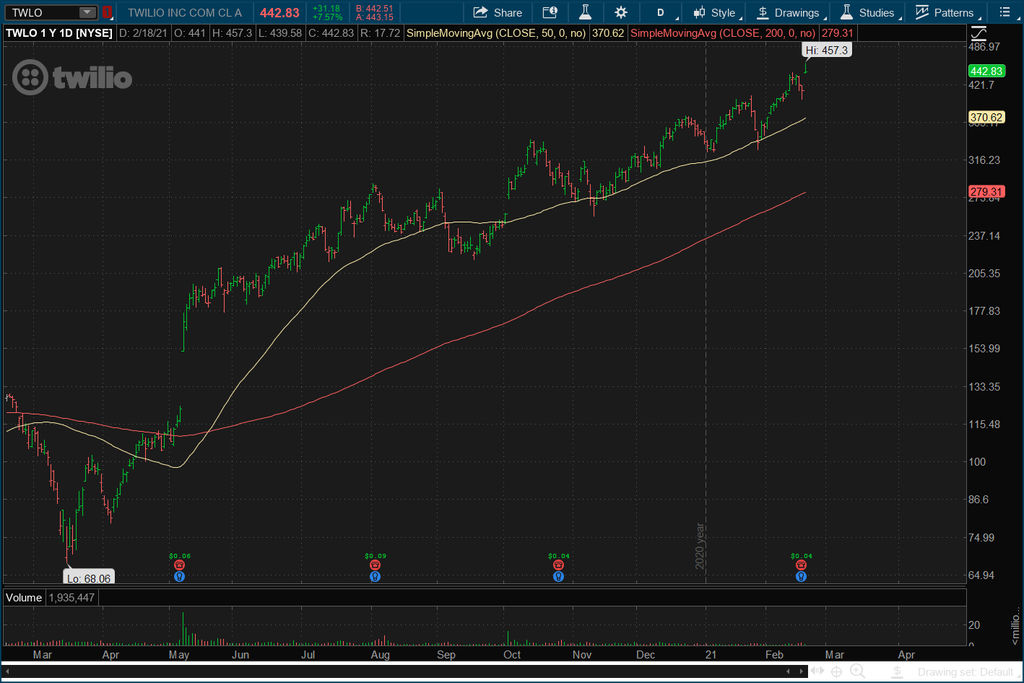
The stock is up about 8% after the report. Another company that has had quite a run in the last year, and is now priced near perfection. Same situation as Shopify, no intentions to sell, no intentions to buy more. No man's land for me.
Chart of the Week
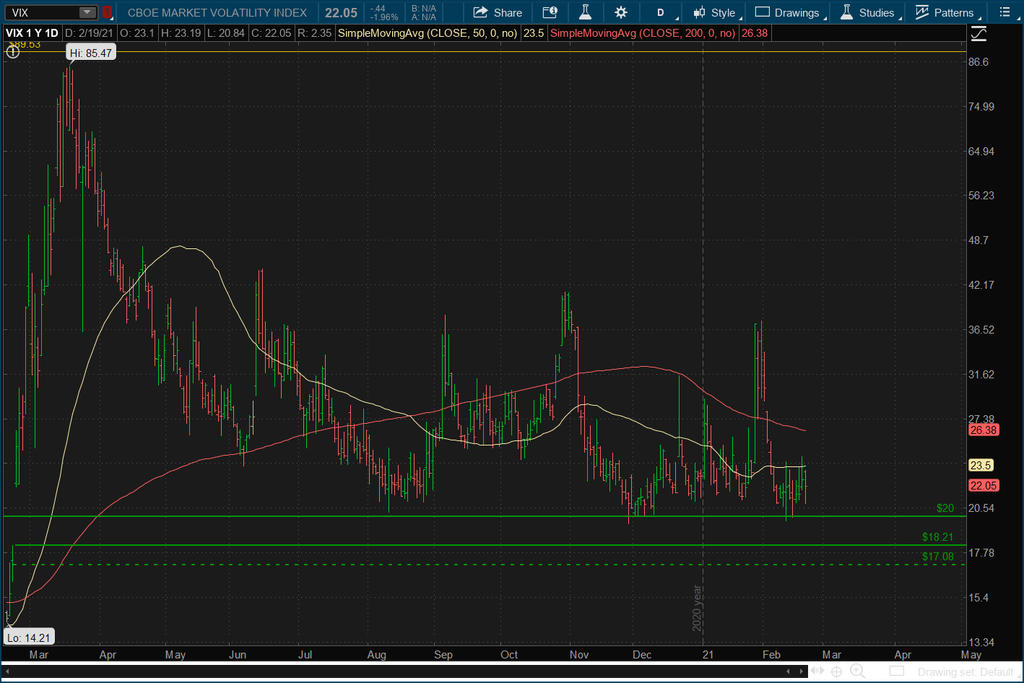
The volatility index (VIX) continues to stubbornly hold above the 20 level. Tuesday’s gap higher in the stock market was accompanied by a 10% increase in the VIX. The result was the stock market giving up its early gains while the VIX held steady. You generally see the VIX in the 12-15 range when the stock market is making all time highs.
Could it be investors hedging their bets, not convinced on the return to normal trade, or just the result of more speculative money in the market these days with negative real rates and lots of stimulus money? I lean towards the latter on this one. Time will tell.
Summary
The solid earnings trend is well intact, while the economy continues to surprise to the upside. Current Atlanta GDP Now Q1 estimates were pushed up to 9.5% after the retail sales numbers this week. The good news is pushing rates higher. The 10-year rate has more than doubled in the last 6 months alone. To put this in perspective though, we still have negative real interest rates across the majority of the yield curve. I don’t see the rise in rates changing the fundamental picture (at least not yet). That being said, if we look at what happens when the equity risk premium drops below 3.0% over the last 11 years, stocks have had some problems in the short term. More on this in a later post.
Stay diversified! Avoid the urge to pile into the stocks/sectors that have gone up the most. Diversification isn’t about maximizing returns, but rather to reduce your risk of permanent loss.
Next week we have 57 S&P 500 companies reporting Q4 results. I’ll be watching Square (NYSE:SQ) on Tuesday, Nvidia (NASDAQ:NVDA) and Teledoc (NYSE:TDOC) on Wednesday, and Salesforce (NYSE:CRM) and Zscaler (NASDAQ:ZS) on Thursday. For economic data we have Consumer Confidence on Tuesday, New Home Sales on Wednesday, and our second look at Q4 GDP on Thursday. Another busy week!
