Get 40% Off
🔥 This hedge fund gained 26.16% in the last month. Get their top stocks with our free stock ideas tool.See stock ideas

S&P 500 Cash Index Breaks Below An Upside Line

Published 02/24/2020, 07:24 AM
Updated 07/09/2023, 06:31 AM
US500
-

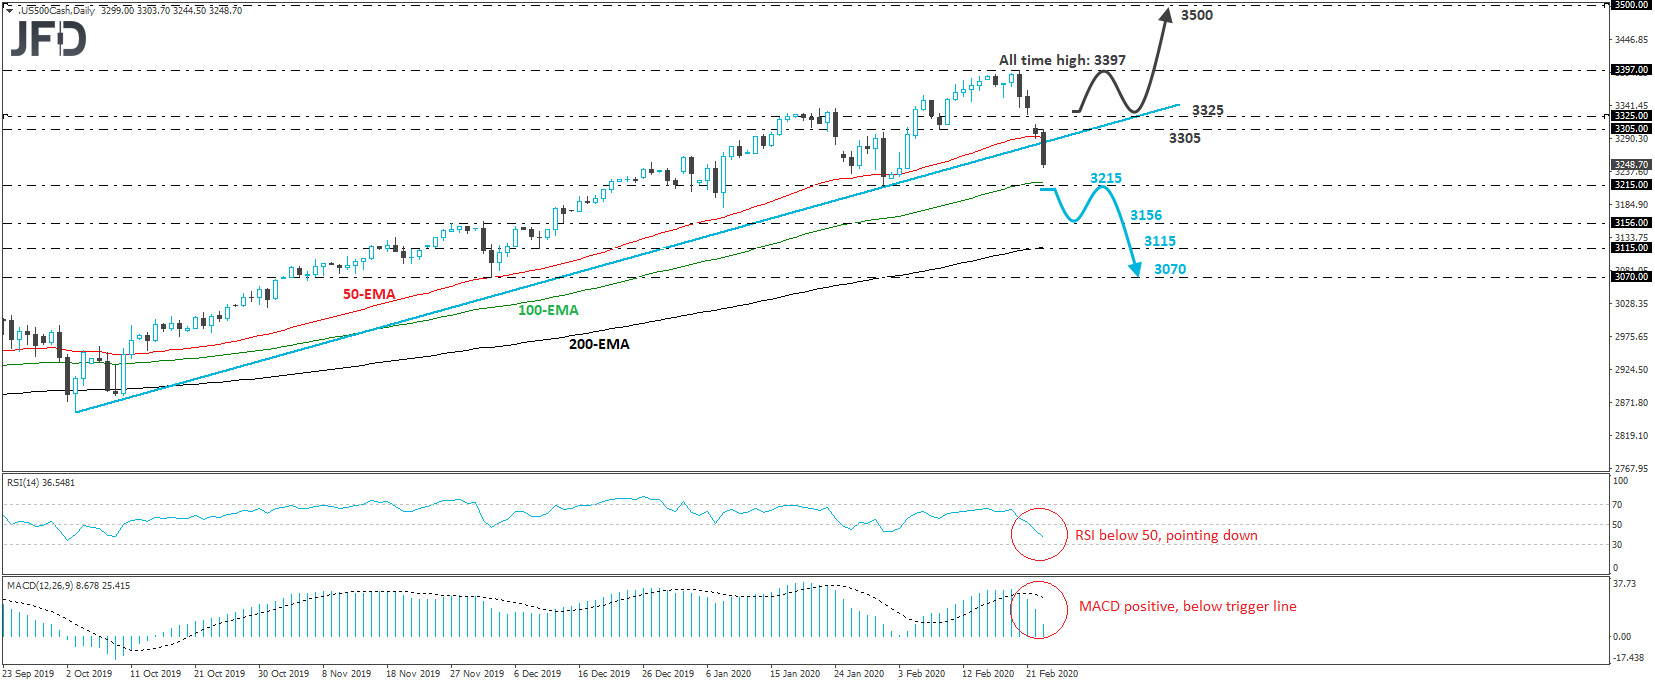
The S&P 500 cash index gapped lower today, and continued to drift south, breaking below the upside support line drawn from the low of October 3rd. This suggests that the actual index will open with a big negative gap today. In our view, the break below the upside line suggests that the outlook has turned somewhat negative, but we prefer to wait for a break below 3215 before we get more confident on that front.

Such a move may confirm a forthcoming lower low and also signal the completion of a non-failure swing top formation. The bears could then get more-than-willing to drive the price towards the 3156 zone, which provided decent resistance from November 27th until December 12th, when it was broken to the upside. Another dip, below 3156, may allow a test near the low of December 10th, at around 3115. If the sellers are not willing to stop there either, then we could see extensions towards the 3070 territory, defined as a support by the low of December 3rd.

Shifting attention to our daily oscillators, we see that the RSI lies below 50 and points down, while the MACD, although positive, stands below its trigger line, pointing south as well. Both indicators suggest that there is ample room for the index to continue drifting south for a while more.

On the upside, we would like to see a rebound above 3325 before we abandon the bearish case. This would also bring the price back above the aforementioned upside line and may allow buyers to aim for another test near the all-time high of 3397. If they don’t hit the brakes near that zone, the index would be brought into unchartered territory with the next possible resistance perhaps being the psychological zone of 3500.
3rd party Ad. Not an offer or recommendation by Investing.com. See disclosure here or remove ads .
S&P 500 cash index daily chart technical analysis

Latest comments

Risk Disclosure: Trading in financial instruments and/or cryptocurrencies involves high risks including the risk of losing some, or all, of your investment amount, and may not be suitable for all investors. Prices of cryptocurrencies are extremely volatile and may be affected by external factors such as financial, regulatory or political events. Trading on margin increases the financial risks.
Before deciding to trade in financial instrument or cryptocurrencies you should be fully informed of the risks and costs associated with trading the financial markets, carefully consider your investment objectives, level of experience, and risk appetite, and seek professional advice where needed.
Fusion Media would like to remind you that the data contained in this website is not necessarily real-time nor accurate. The data and prices on the website are not necessarily provided by any market or exchange, but may be provided by market makers, and so prices may not be accurate and may differ from the actual price at any given market, meaning prices are indicative and not appropriate for trading purposes. Fusion Media and any provider of the data contained in this website will not accept liability for any loss or damage as a result of your trading, or your reliance on the information contained within this website.
It is prohibited to use, store, reproduce, display, modify, transmit or distribute the data contained in this website without the explicit prior written permission of Fusion Media and/or the data provider. All intellectual property rights are reserved by the providers and/or the exchange providing the data contained in this website.
Fusion Media may be compensated by the advertisers that appear on the website, based on your interaction with the advertisements or advertisers.
© 2007-2024 - Fusion Media Limited. All Rights Reserved.