Get 40% Off
🤯 Perficient is up a mind-blowing 53%. Our ProPicks AI saw the buying opportunity in March.Read full update

S&P 500 And Nasdaq 100 Analysis – May 21, 2018

Published 05/21/2018, 07:33 AM
Updated 03/21/2024, 07:45 AM

U.S. equities are set to make gains after news that a trade war between the world’s two largest economies is on hold. The Treasury secretary, Steven Mnuchin, reported on Sunday that negotiations with China have progressed saying, “We’re putting the trade war on hold, right now, and we have agreed to put the tariffs on hold while we try to execute the framework.” The two sides are reported to have reached a consensus on taking effective measures to cut the deficit.

It is notable that the Russell 2000 Index, which is a small-cap stock market index, has continued to outperform hitting its third straight record closing high. The companies in this index can be considered to be fairly immune to tariffs.

S&P 500
On the 4-hourly chart, the S&P 500 (SPX) broke out to the upside from a symmetrical triangle with a measured target near the 2762 resistance level. However, the index will face some immediate upside resistance at 2740. A break of the 2762 is needed to a continuation towards the highs at 2800. On the flip-side, a reversal and break of 2724 will open the door to declines towards support at 2715 and then 2705.
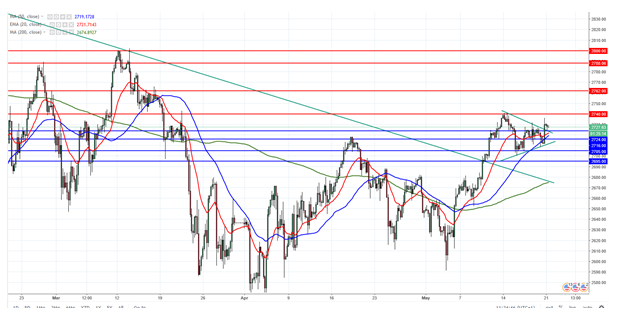
S&P 500 Performance Chart
Nasdaq 100

On the 4-hourly chart, the Nasdaq 100 (NDX) is trading in a triangle and an upside break above 6945 could point to a move to the 7090 level with resistance at 7000. However, a reversal and break of support at 6870 will likely open the way for declines to 6780 followed by 6720.
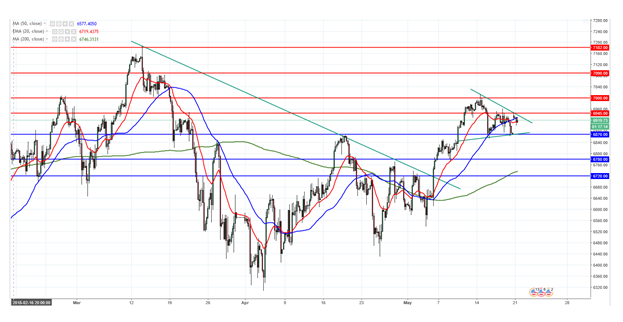
Nasdaq 100 Performance Chart

3rd party Ad. Not an offer or recommendation by Investing.com. See disclosure here or remove ads .

Latest comments

Risk Disclosure: Trading in financial instruments and/or cryptocurrencies involves high risks including the risk of losing some, or all, of your investment amount, and may not be suitable for all investors. Prices of cryptocurrencies are extremely volatile and may be affected by external factors such as financial, regulatory or political events. Trading on margin increases the financial risks.
Before deciding to trade in financial instrument or cryptocurrencies you should be fully informed of the risks and costs associated with trading the financial markets, carefully consider your investment objectives, level of experience, and risk appetite, and seek professional advice where needed.
Fusion Media would like to remind you that the data contained in this website is not necessarily real-time nor accurate. The data and prices on the website are not necessarily provided by any market or exchange, but may be provided by market makers, and so prices may not be accurate and may differ from the actual price at any given market, meaning prices are indicative and not appropriate for trading purposes. Fusion Media and any provider of the data contained in this website will not accept liability for any loss or damage as a result of your trading, or your reliance on the information contained within this website.
It is prohibited to use, store, reproduce, display, modify, transmit or distribute the data contained in this website without the explicit prior written permission of Fusion Media and/or the data provider. All intellectual property rights are reserved by the providers and/or the exchange providing the data contained in this website.
Fusion Media may be compensated by the advertisers that appear on the website, based on your interaction with the advertisements or advertisers.
© 2007-2024 - Fusion Media Limited. All Rights Reserved.