Get 40% Off
💰 Buffett reveals a $6.7B stake in Chubb. Copy the full portfolio for FREE with InvestingPro’s Stock Ideas toolCopy Portfolio

S&P 500 and NASDAQ 100 Analysis: April 3, 2018

Published 04/03/2018, 09:25 AM
Updated 03/21/2024, 07:45 AM
NDX
-
US500
-
AMZN
-
TSLA
-
MAL
-
SRRc1
-

US equity markets dropped sharply on Monday as investors sold technology shares amid resurgent worries over a trade war. The sell-off started after China retaliated against Trump’s tariffs on steel and aluminium with their own tariffs of 25% on $3bn in food imports from the US, raising the prospect of a trade war between the two countries.

Technology stocks, which had been driving the bull market in US equities, are now leading the market lower. Amazon (NASDAQ:AMZN) shares fell 6%, as President Donald Trump continued his attack on Amazon over the pricing of its deliveries through the US Postal Service and promised to make changes. Tesla (NASDAQ:TSLA) also continued to decline after a car that crashed, killing its driver, was operating on Autopilot.

Although the decline in US equities yesterday came as European markets were closed, this is perhaps an unexpected start to a new quarter. Furthermore, this is the second deep decline in two months, with the S&P 500 having dropped below an important moving average. It is also notable that the market is more sensitive to negative news than it has been for some time.

S&P 500

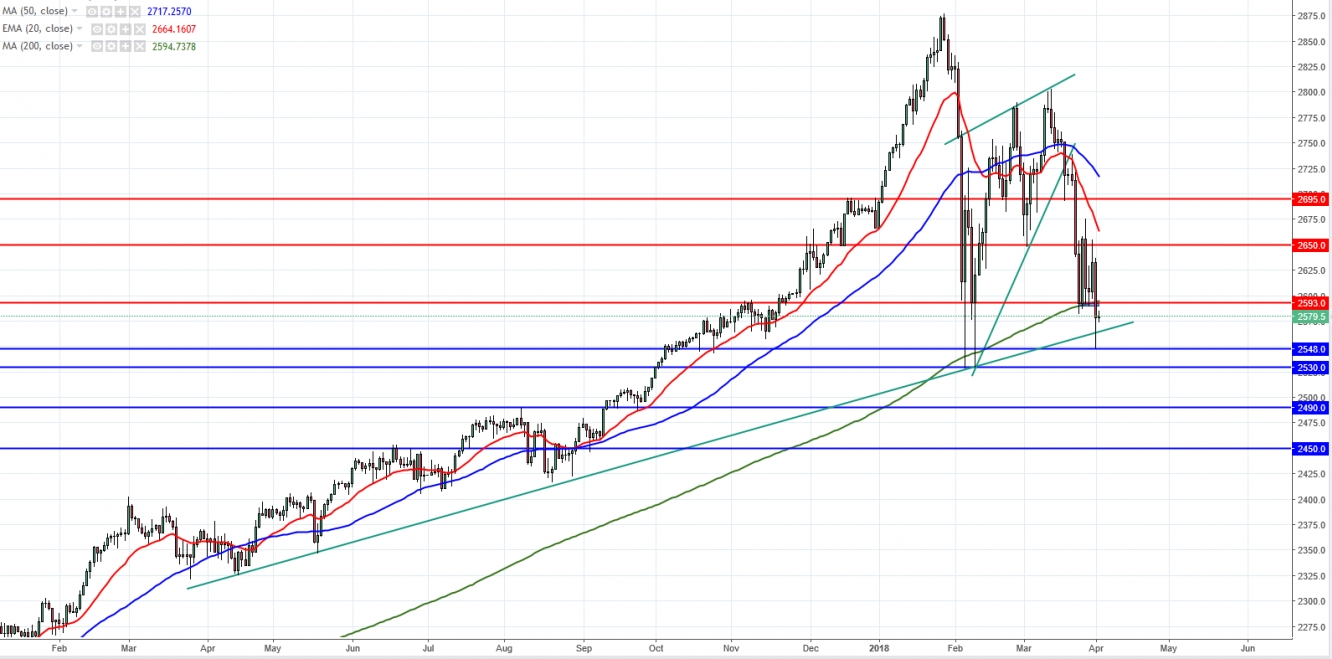
On the daily chart, the S&P500 (SPX) has now broken the 200MA highlighted in our previous report. This is a technical development observed by many market participants and it remains to be seen how much of an impact it has on sentiment. The break of this critical support opens the way to February lows at 2530 with some immediate support at 2548. A break of the February lows could lead to deeper declines to 2490. However, a bullish reversal and close above the 200MA at 2593 is needed to change the outlook, with further upside resistance 2650.

3rd party Ad. Not an offer or recommendation by Investing.com. See disclosure here or remove ads .

S&P500 Daily Chart

NASDAQ 100

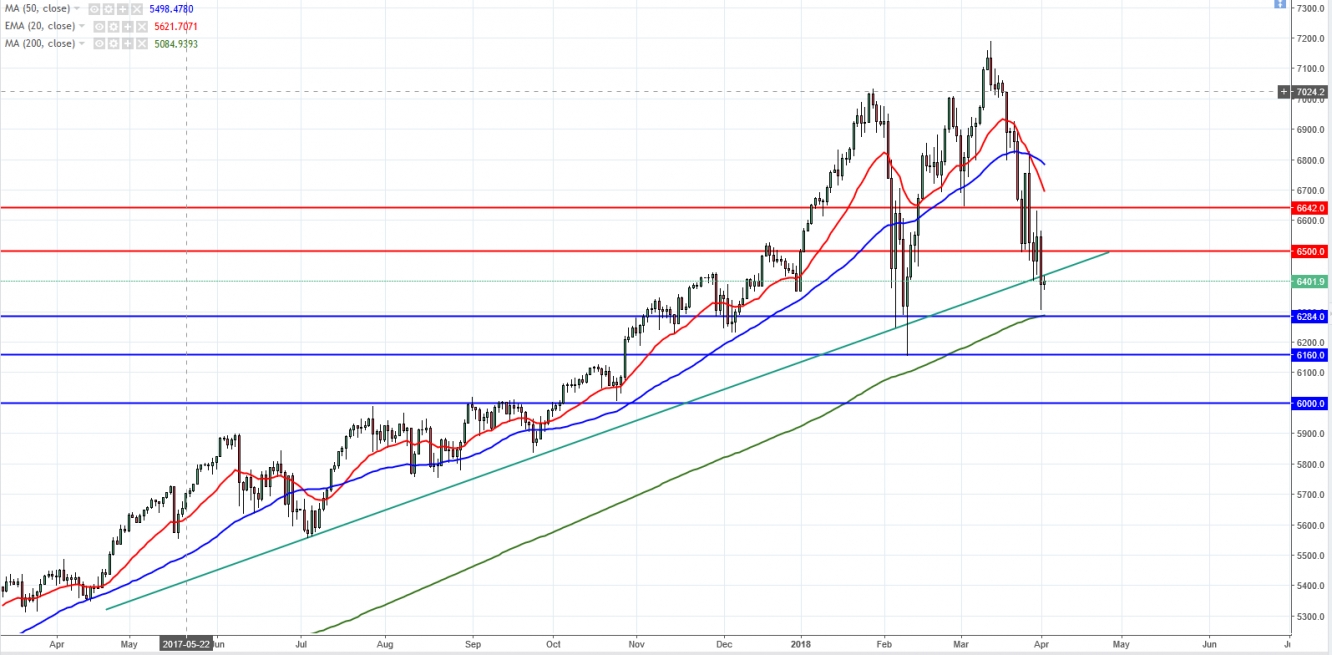
On the daily chart, the NASDAQ 100 (NDX) put in a bearish reversal after making a new all-time high. The index is now trading close to, but just above, the 200MA at 6284. The June trend-line has been broken and will be tested for resistance. If the critical support at 6284 is broken, a decline to February lows at 6160 is likely, with further downside support near the psychologically important 6000. On the flip-side, a bullish reversal and break of 6500 would open the way for a move to resistance at 6642.

NASDAQ100 Daily Chart

Latest comments

Risk Disclosure: Trading in financial instruments and/or cryptocurrencies involves high risks including the risk of losing some, or all, of your investment amount, and may not be suitable for all investors. Prices of cryptocurrencies are extremely volatile and may be affected by external factors such as financial, regulatory or political events. Trading on margin increases the financial risks.
Before deciding to trade in financial instrument or cryptocurrencies you should be fully informed of the risks and costs associated with trading the financial markets, carefully consider your investment objectives, level of experience, and risk appetite, and seek professional advice where needed.
Fusion Media would like to remind you that the data contained in this website is not necessarily real-time nor accurate. The data and prices on the website are not necessarily provided by any market or exchange, but may be provided by market makers, and so prices may not be accurate and may differ from the actual price at any given market, meaning prices are indicative and not appropriate for trading purposes. Fusion Media and any provider of the data contained in this website will not accept liability for any loss or damage as a result of your trading, or your reliance on the information contained within this website.
It is prohibited to use, store, reproduce, display, modify, transmit or distribute the data contained in this website without the explicit prior written permission of Fusion Media and/or the data provider. All intellectual property rights are reserved by the providers and/or the exchange providing the data contained in this website.
Fusion Media may be compensated by the advertisers that appear on the website, based on your interaction with the advertisements or advertisers.
© 2007-2024 - Fusion Media Limited. All Rights Reserved.