Get 40% Off
🚨 Volatile Markets? Find Hidden Gems for Serious Outperformance
Find Stocks Now

S&P 'Bull Trap' Becomes A 'Bear Trap'

Published 11/17/2017, 12:00 AM
Updated 07/09/2023, 06:31 AM

As this rally has often done, just as you expect a reversal to start, bulls come in (hard) to bid up the market. The S&P had the clearest switch as it moved from a 'bull trap' to a 'bear trap'. If it can post a break of 2,597 it will have little to stop it; in such a scenario watch for a fresh MACD 'buy' which would confirm recent losses as a pullback 'buy' opportunity. Stops on a loss of 2,557.
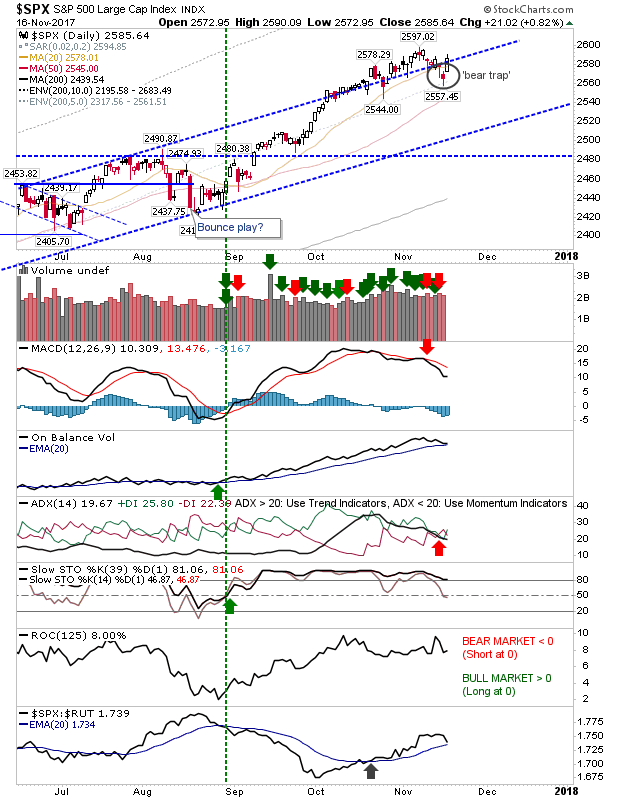
SPX Daily Chart


More impressive was the recovery in the Russell 2000. I'm not sure it has done enough to consume what will be plentiful supply all the way to 1,515. Despite the 1.5% gain there wasn't a significant improvement in technicals. There will not have been many longs to have taken a punt on the drift below the 50-day MA so much will depend on the strength of the short squeeze – Thursday was a good start.
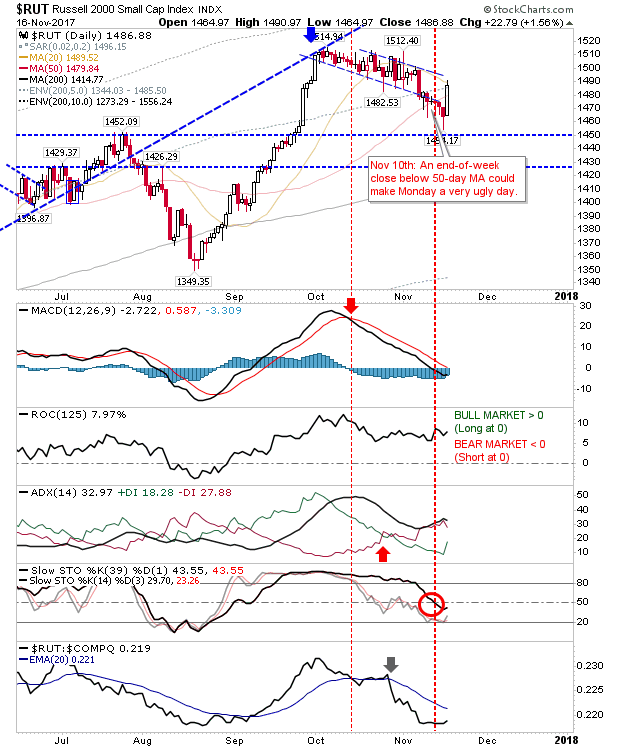
RUT Daily Chart


The NASDAQ didn't disappoint. It was the safest long trade and despite the morning gap it was able to post additional gains. Upper channel resistance remains the upside target. Thursday's volume registers as confirmed accumulation.
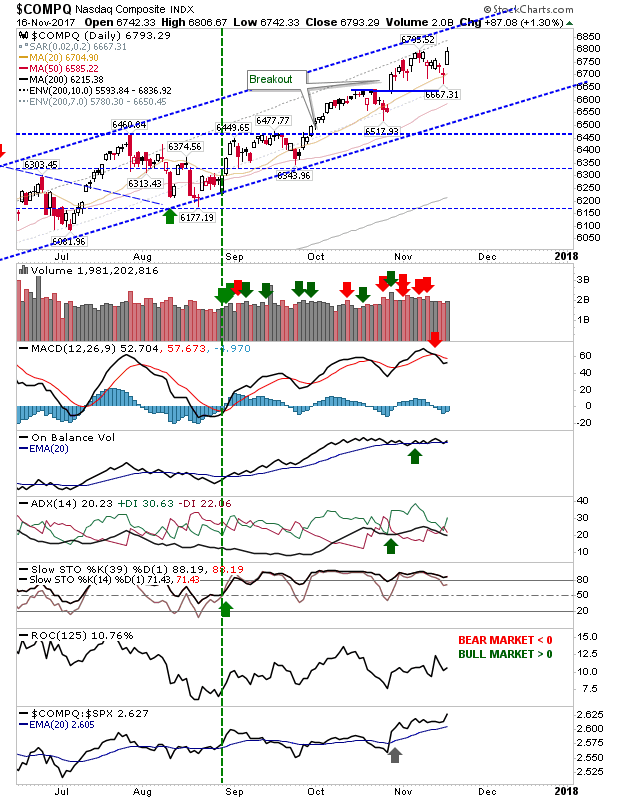
COMPQ Daily Chart


The Dow Jones only managed a weak bounce but the telegraphed 'buy' at support should have survived a stop test.
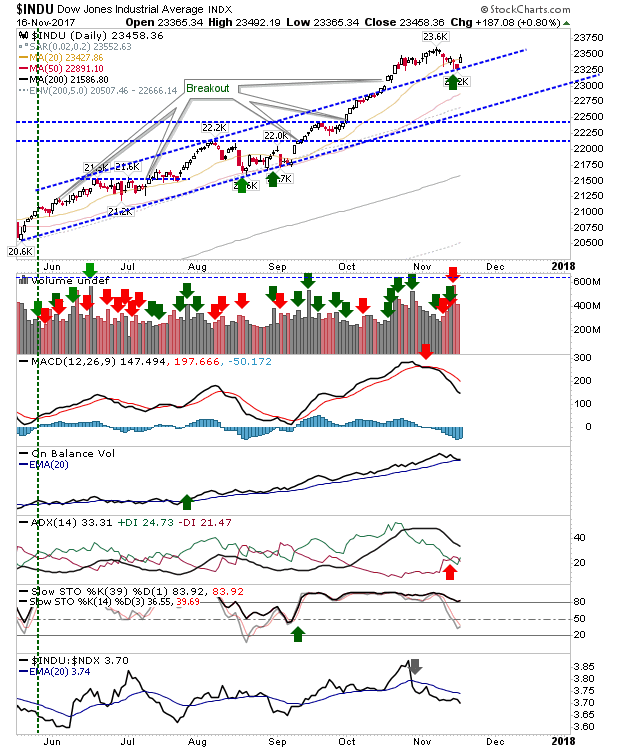
INDU Daily Chart


Thursday's action was a useful start. Key to Friday will be closing in the upper part of Thursday's intraday range – irrespective of how much ground it gives up over the course of the day.

3rd party Ad. Not an offer or recommendation by Investing.com. See disclosure here or remove ads .

Latest comments

you are naive. stock market will not stay longer at this level than 1 week, we have to expect big declines, and what you see now is their first wave, which can last about 6 months, then we can tell whether it was correction or reversalThe point to which the graph falls is unknown and can not be calculated, at about 2300 we will probably find the answer.
Didn't look like a bull trap
Seems like RUT is about to break bull flag in a big way, however, overnight price action is weakening bull argument.  Nikkei gave up most of the gains. ES YM RUT are red in morning.  UJ is down and GC is up.  Here is one chart of GC that is lately defying bull argument.  Someone is building hedge for quite sometime now
Risk Disclosure: Trading in financial instruments and/or cryptocurrencies involves high risks including the risk of losing some, or all, of your investment amount, and may not be suitable for all investors. Prices of cryptocurrencies are extremely volatile and may be affected by external factors such as financial, regulatory or political events. Trading on margin increases the financial risks.
Before deciding to trade in financial instrument or cryptocurrencies you should be fully informed of the risks and costs associated with trading the financial markets, carefully consider your investment objectives, level of experience, and risk appetite, and seek professional advice where needed.
Fusion Media would like to remind you that the data contained in this website is not necessarily real-time nor accurate. The data and prices on the website are not necessarily provided by any market or exchange, but may be provided by market makers, and so prices may not be accurate and may differ from the actual price at any given market, meaning prices are indicative and not appropriate for trading purposes. Fusion Media and any provider of the data contained in this website will not accept liability for any loss or damage as a result of your trading, or your reliance on the information contained within this website.
It is prohibited to use, store, reproduce, display, modify, transmit or distribute the data contained in this website without the explicit prior written permission of Fusion Media and/or the data provider. All intellectual property rights are reserved by the providers and/or the exchange providing the data contained in this website.
Fusion Media may be compensated by the advertisers that appear on the website, based on your interaction with the advertisements or advertisers.
© 2007-2024 - Fusion Media Limited. All Rights Reserved.