Apple Inc. (AAPL) designs, manufactures and markets mobile communication and media devices, personal computers, and portable digital music players, and sells a variety of related software, services, peripherals, networking solutions, and third-party digital content and applications.
In case you hadn’t heard, AAPL is releasing earnings today, AMC.
I’m, going to show you some things that I see, that perhaps you haven’t – and they matter, a lot.
First, I do remind of the recent four articles I posted on AAPL. I think the titles summarize the articles fairly well. Feel free to click the links to read ‘em.
4-18-2013
Apple (AAPL) - This Just Isn't the Company it Used to Be... And it Never Will Be Again."
1-23-2013
Apple (AAPL) - "Just the Facts Ma'am" -- Well, that Supports the Opinion: "Everything has Changed. The Old AAPL is No More."
12-10-2012
AAPL - Everything has Changed. The Old AAPL is No More. The New AAPL is a Riskier Entity and the Market Doesn't Know What that Means Yet
12-5-2012
Apple (AAPL) - Have We Moved into a Totally New Volatility Paradigm for This Company? Has Everything Changed?
On to today… First, I have included the two-year AAPL Charts Tab below. The top portion is the stock price the bottom is the vol (IV30™ - red vs HV20™ - blue vs HV180™ - pink).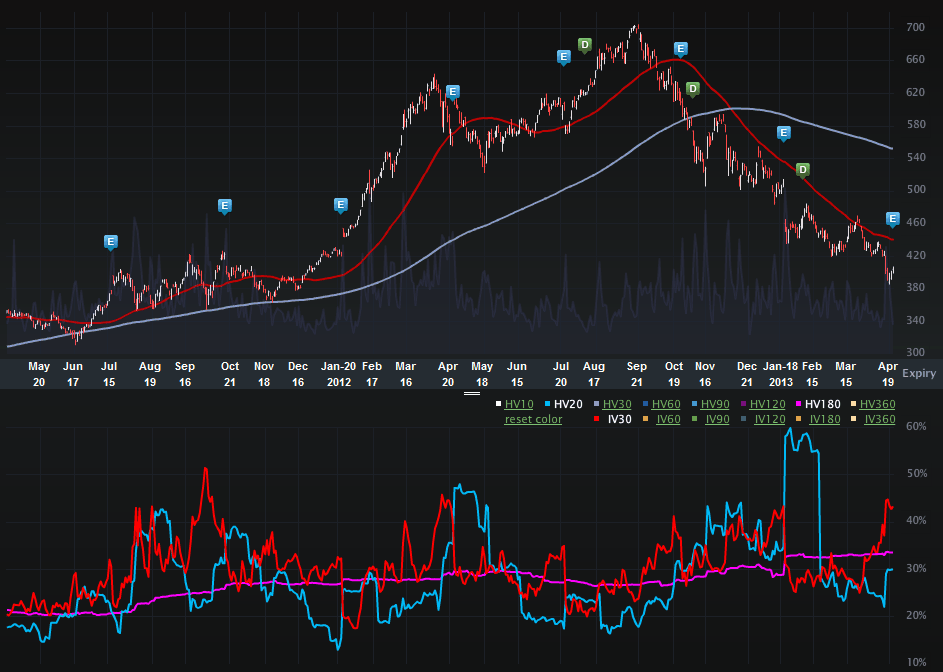
On the stock side we can see AAPL’s incredible fall from the highs of over $700 just ~seven months ago. The firm is down over 40% from those highs or over $200 billion in market cap. I saw a great stat that put the number in context – AAPL has lost the market cap of Google over the last seven months.
OK, but who didn’t know that?... It’s the vol where the picture is drawn and the conclusion is made. Let’s turn to the two-year IV30™ chart in isolation.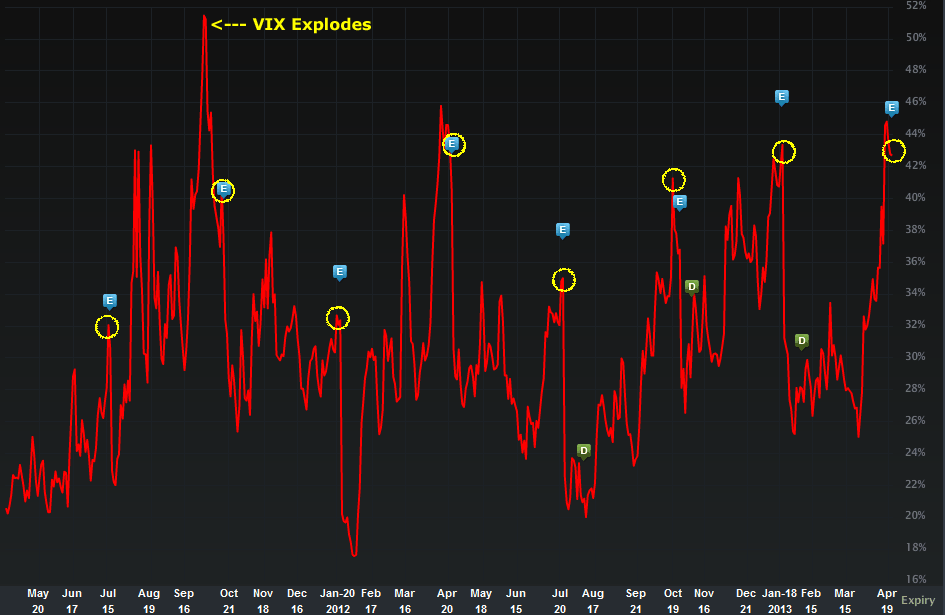
I have circled the last seven earnings cycles (plus the one today). Though the pattern is rough, recently it has essentially seen the implied rising to higher levels with each earnings cycle. The option market reflects greater risk in AAPL for each earnings cycle. A fair question is, “is this warranted?”
Here is the resounding yes. Below I have included three charts.
(1) The HV360™ for AAPL vs the HV360 for SPY. HV360 is the historical (realized) volatility of the stock over the last 360 trading days – which is about a 1.5 year average (there are 252 trading days a year).
(2) Same chart, but using HV180™ (~9 month average)
(3) Same chart, but using HV120™ (~half a year average)
You may wonder, “why, Ophir, did you put three charts with three different historical vol measures?” The answer is, because I’m not cherry picking – it’s consistent from a six-month moving average to 1.5 year moving average. This is a real and tangible (and large) risk divergence from the market.
For all the charts, the yellow curve represents the SPY (S&P 500).
HV360™ 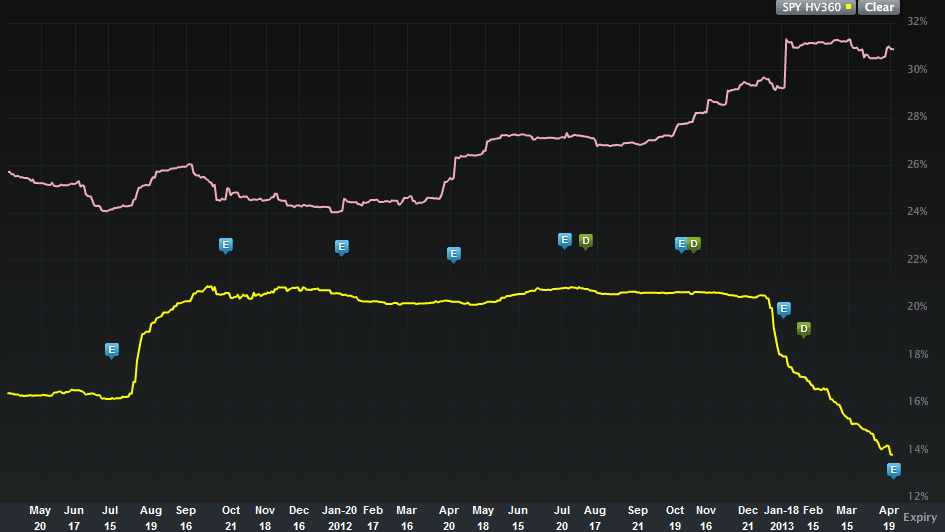
HV180™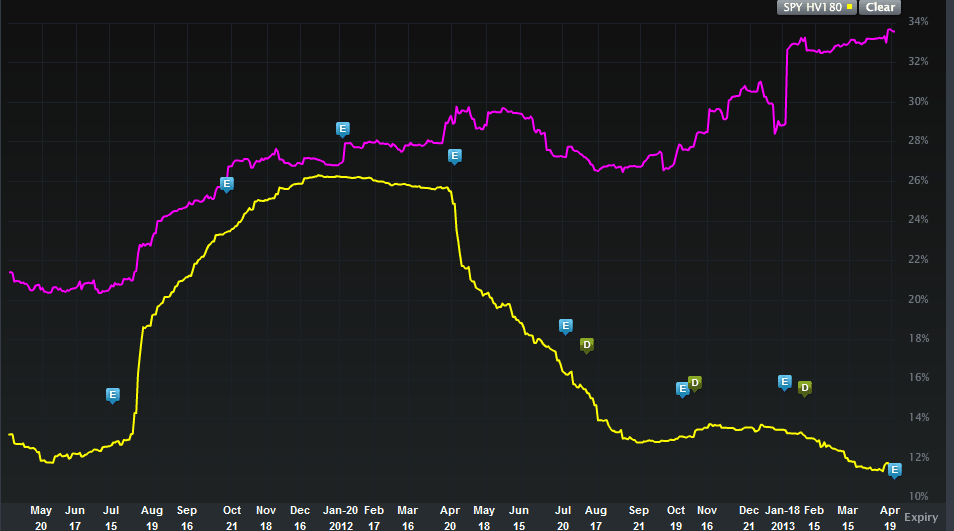
HV120™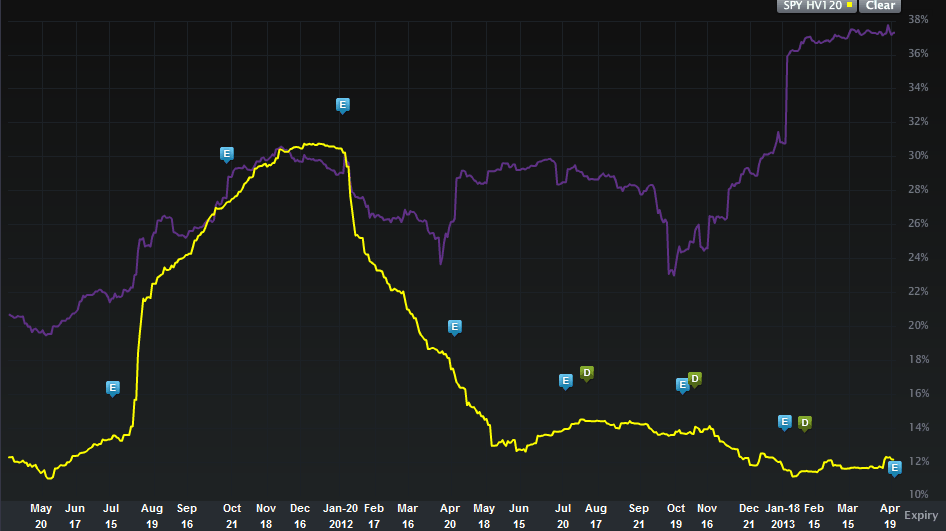
We can see for all three time-periods, that as the market realized vol has been declining abruptly (the yellow curve) AAPL’s realized vol has been increasing and diverging immensely from the market. In English, AAPL has become more and more risky, while the market has become less and less risky.
It’s important to understand the context of the rising implied vols in AAPL into earnings. These implieds are rising (from earnings to earnings) while the market is less and less risky. It’s also interesting to see that the implieds (future looking risk) in AAPL are rising as the historical vols (realized vols) are also rising.
So what?...
AAPL has become remarkably more risky in the last two years relative to the overall market. It has gone from the leader in worldwide technology to a laggard in certain areas that they in fact invented (aka iOS as one example). The higher implied vols reflect that risk and they are justified with the massive divergence in the historical (realized vols).
Finally, let's look to the Options Tab (below).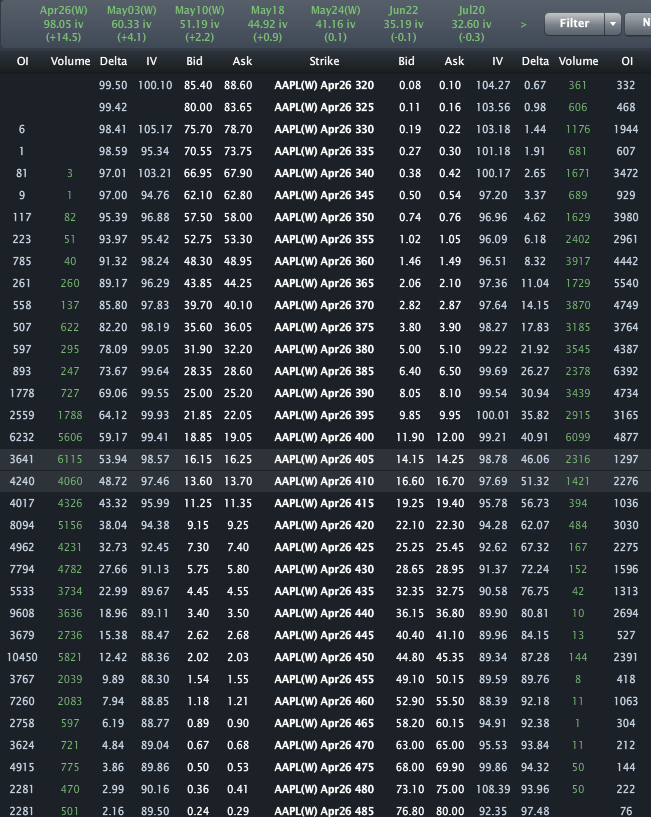
We can see the ATM straddle ($405 strike) in the weeklies is pricing in a ~$30 move off of the report (one standard deviation) and a $60 move within two-standard deviations.
Nobody really knows how the market will respond. It feels like AAPL might even rebound big if they can squeeze out any good news (which they very well may). But this is not the same company they used to be. Their leader is no longer with us. And a 40% drop in the long-term is not necessarily the limit to the downside.
As for tomorrow’s reaction to today’s news (earnings), I’d say watch for over optimism and over pessimism. In other words, watch for a big move off of little news, and an even bigger move off of big news. Long-term – this is a risky stock that has diverged so violently from the rest of the market that it must be considered a different entity than it once was.
Caution to all sides and all trades in this one. Not just today, but for the next… forever…
Disclosure: This is trade analysis, not a recommendation.
Images provided by Livevol®
- English (UK)
- English (India)
- English (Canada)
- English (Australia)
- English (South Africa)
- English (Philippines)
- English (Nigeria)
- Deutsch
- Español (España)
- Español (México)
- Français
- Italiano
- Nederlands
- Português (Portugal)
- Polski
- Português (Brasil)
- Русский
- Türkçe
- العربية
- Ελληνικά
- Svenska
- Suomi
- עברית
- 日本語
- 한국어
- 简体中文
- 繁體中文
- Bahasa Indonesia
- Bahasa Melayu
- ไทย
- Tiếng Việt
- हिंदी
Some Things You May Know About Apple, And Some You Do Not
Published 04/23/2013, 11:23 AM
Updated 07/09/2023, 06:31 AM
Some Things You May Know About Apple, And Some You Do Not
3rd party Ad. Not an offer or recommendation by Investing.com. See disclosure here or
remove ads
.
Latest comments
Install Our App
Risk Disclosure: Trading in financial instruments and/or cryptocurrencies involves high risks including the risk of losing some, or all, of your investment amount, and may not be suitable for all investors. Prices of cryptocurrencies are extremely volatile and may be affected by external factors such as financial, regulatory or political events. Trading on margin increases the financial risks.
Before deciding to trade in financial instrument or cryptocurrencies you should be fully informed of the risks and costs associated with trading the financial markets, carefully consider your investment objectives, level of experience, and risk appetite, and seek professional advice where needed.
Fusion Media would like to remind you that the data contained in this website is not necessarily real-time nor accurate. The data and prices on the website are not necessarily provided by any market or exchange, but may be provided by market makers, and so prices may not be accurate and may differ from the actual price at any given market, meaning prices are indicative and not appropriate for trading purposes. Fusion Media and any provider of the data contained in this website will not accept liability for any loss or damage as a result of your trading, or your reliance on the information contained within this website.
It is prohibited to use, store, reproduce, display, modify, transmit or distribute the data contained in this website without the explicit prior written permission of Fusion Media and/or the data provider. All intellectual property rights are reserved by the providers and/or the exchange providing the data contained in this website.
Fusion Media may be compensated by the advertisers that appear on the website, based on your interaction with the advertisements or advertisers.
© 2007-2024 - Fusion Media Limited. All Rights Reserved.
