Following four months of contraction, export container counts are unchanged year-over-year while economically intuitive imports grew in July.
For the month of July 2013, the economically intuitive imports growth accelerated 7.7% month-over-month, is up 5.2% compared to July 2012, and is up 2.6% year-to-date. There is a direct linkage between imports and USA economic activity – and growth in imports foretells real economic growth.
Exports (which are an indicator of competitiveness and global economic growth) growth accelerated 8.1% month-over-month, is the same as the count in July 2012, but is down 2.6% year-to-date.
At this point, there is no obvious trend for either exports or imports.
There is reasonable correlation between the container counts and the US Census trade data also being analyzed by Econintersect. But trade data lags several months after the more timely container counts. From the graph below, it can be observed that exports (red line) have a slightly negative long term trend line over the last 3 years, whilst imports (blue bars) seem flat over the last year – but now has a negative 3 month trend.
Unadjusted Year-over-Year Change in Container Counts – Ports of Los Angeles and Long Beach Combined – Imports (red line) and Exports (blue bars) 
Econintersect considers import and exports significant elements in determining economic health (please see caveats below). the takeaway from the graphs below is that imports still have not returned to pre-2007 recession levels, while exports did recover.
Unadjusted Import Container Counts – Ports of Los Angeles and Long Beach Combined
Unadjusted Export Container Counts – Ports of Los Angeles and Long Beach Combined
The Ports of LA and Long Beach account for much (approximately 40%) of the container movement into and out of the United States – and these two ports report their data significantly earlier than other USA ports. Most of the manufactured goods move between countries in sea containers (except larger rolling items such as automobiles). This pulse point is an early indicator of the health of the economy.
Containers come in many sizes so a uniform method involves expressing the volume of containers in TEU, the volume of a standard 20 foot long sea container. Thus a standard 40 foot container would be 2 TEU.
There is a good correlation between container counts and trade data (the US Census trade data is shown on the graph below). Using container counts gives a two month advance window on trade data.
Inflation Adjusted Year-over-Year Change Imports (blue line) and Exports (red line) 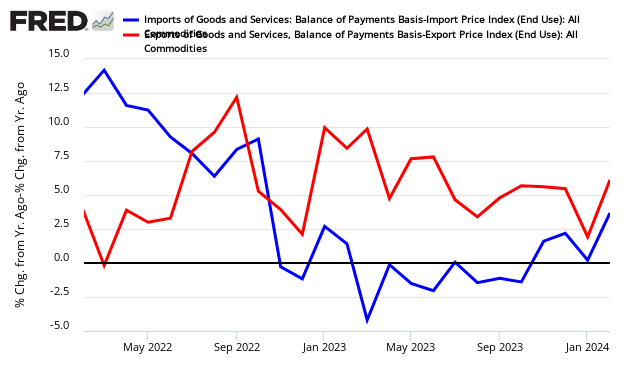
Transport has been languishing with very weak growth.
Caveats on the Use of Container Counts
These are extraordinary times with historical data confused by a massive depression and significant monetary and fiscal intervention by government. Further containers are a relatively new technology and had a 14 year continuous growth streak from 1993 to 2006. There is not enough history to make any associations with economic growth – and we must assume a correlation exists.
Further, it is impossible from this data to understand commodity or goods breakdown (e.g. what is the contents in the containers). Any expansion or contraction cannot be analyzed to understand causation.
Imports are a particularly good tool to view the Main Street economy. Imports overreact to economic changes much like a double ETF making movements easy to see.
Contracting imports historically is a recession marker, as consumers and businesses start to hunker down. Main Street and Wall Street are not necessarily in phase and imports can reflect the direction for Main Street when Wall Street may be saying something different. During some recessions, consumers and businesses hunkered down before the Wall Street recession hit – and in the 2007 recession the contraction began 10 months into the recession. 
Above graph with current data:
Imports of Goods and Services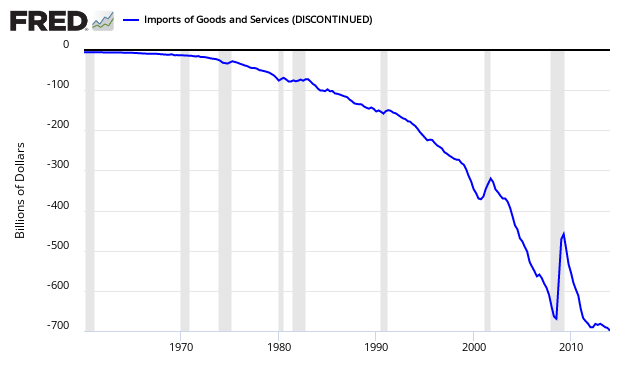
Econintersect determines the month-over-month change by subtracting the current month’s year-over-year change from the previous month’s year-over-year change. This is the best of the bad options available to determine month-over-month trends – as the preferred methodology would be to use multi-year data (but the New Normal effects and the Great Recession distort historical data).
- English (UK)
- English (India)
- English (Canada)
- English (Australia)
- English (South Africa)
- English (Philippines)
- English (Nigeria)
- Deutsch
- Español (España)
- Español (México)
- Français
- Italiano
- Nederlands
- Polski
- Português (Portugal)
- Português (Brasil)
- Русский
- Türkçe
- العربية
- Ελληνικά
- Svenska
- Suomi
- עברית
- 日本語
- 한국어
- 简体中文
- 繁體中文
- Bahasa Indonesia
- Bahasa Melayu
- ไทย
- Tiếng Việt
- हिंदी
Some Sign Of Life For Sea Container Counts In July 2013
Published 08/19/2013, 12:27 AM
Updated 05/14/2017, 06:45 AM
Some Sign Of Life For Sea Container Counts In July 2013
Latest comments
Loading next article…
Install Our App
Risk Disclosure: Trading in financial instruments and/or cryptocurrencies involves high risks including the risk of losing some, or all, of your investment amount, and may not be suitable for all investors. Prices of cryptocurrencies are extremely volatile and may be affected by external factors such as financial, regulatory or political events. Trading on margin increases the financial risks.
Before deciding to trade in financial instrument or cryptocurrencies you should be fully informed of the risks and costs associated with trading the financial markets, carefully consider your investment objectives, level of experience, and risk appetite, and seek professional advice where needed.
Fusion Media would like to remind you that the data contained in this website is not necessarily real-time nor accurate. The data and prices on the website are not necessarily provided by any market or exchange, but may be provided by market makers, and so prices may not be accurate and may differ from the actual price at any given market, meaning prices are indicative and not appropriate for trading purposes. Fusion Media and any provider of the data contained in this website will not accept liability for any loss or damage as a result of your trading, or your reliance on the information contained within this website.
It is prohibited to use, store, reproduce, display, modify, transmit or distribute the data contained in this website without the explicit prior written permission of Fusion Media and/or the data provider. All intellectual property rights are reserved by the providers and/or the exchange providing the data contained in this website.
Fusion Media may be compensated by the advertisers that appear on the website, based on your interaction with the advertisements or advertisers.
© 2007-2024 - Fusion Media Limited. All Rights Reserved.