The Scotts Miracle-Gro Company, (SMG), along with its subsidiaries, is engaged in the manufacturing, marketing and sale of lawn and garden care products, with products for professional horticulture as well. It operates in three segments: Global Consumer, Global Professional and Scotts LawnService.
Let’s start with the news that drove the stock down and vol up on open this morning with an eye on bad news that was released just a month ago that seems to fly in the face of this report. More on the older news later in the article.
Scotts Miracle-Gro Co. said it likely will not meet its expected sales growth target this year as demand for its lawn and garden care products has slowed following a fast start to the lawn care season.
The Marysville-based company has boosted sales by 3 percent at its “largest retail partners” through the first half of the year, short of the 6 percent to 8 percent increase it had expected this year. Scotts (NYSE:SMG) does not expect to meet its adjusted earnings per share target of $2.65 to $2.85 for 2012.
Scotts got out to a fast start during the second quarter, but “the gardening season, which traditionally peaks in mid- to late-May, has not met expectations,” the company said.
Scotts also expects its business in Europe to fall short amid economic uncertainty and poor weather. -- Source: Columbus Business First via Yahoo! Finance; Scotts Miracle-Gro expects to fall short of 2012 sales goals, written by Rick Rouan
ANALYSIS
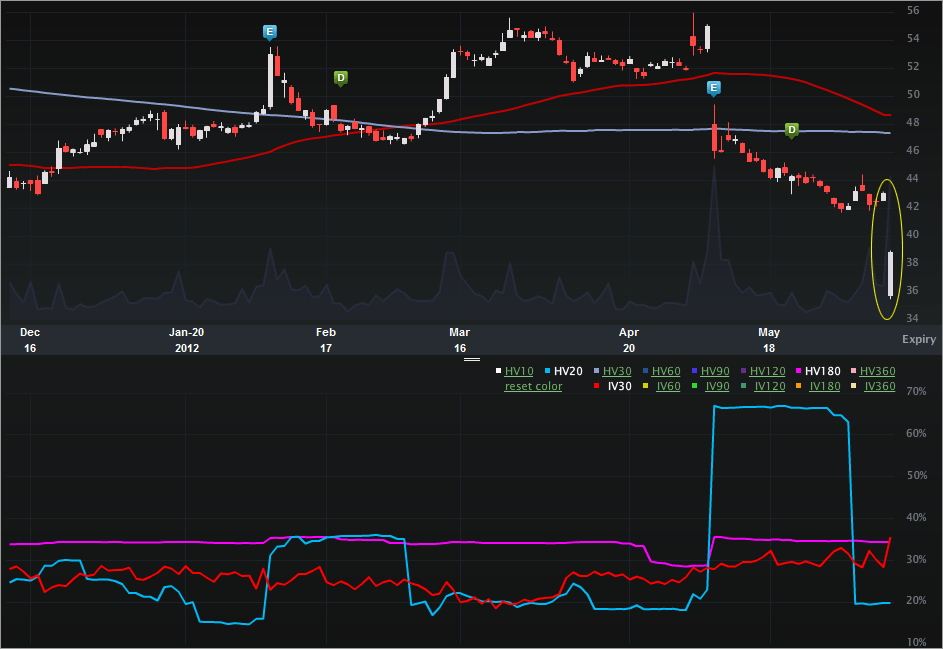
So there we have it – a missed sales number (there's a lot more to that, which we'll discuss in a sec). The move drew my attention to the vol. Note that this is “just” a 35% vol name, even with the big rise today. Let’s turn to the Charts Tab (six months), below. The top portion is the stock price, the bottom is the vol (IV30™ - red vs HV20™ - blue vs HV180™ - pink).
On the stock side, we can see the gap down today on the news. The 52 wk range for SMG is [$38.94, $55.57], so the price levels the stock has hit today are in fact new annual lows. In fact, when looking back two years, the levels today are also two year lows.
It’s important to note the gap down that occurred on 5-8-2012, when the stock dropped off of earnings from $55 to $46.14, or 16% in one day. Here’s a news snippet from that day:
(Reuters) - Lawn and garden products maker Scotts Miracle-Gro Co (SMG.N) said it may miss its gross margin forecast for the year because of rising material and distribution costs and higher spending on promotions, sending its shares skidding as much as 16 percent.
The warning overshadowed stronger-than-expected second-quarter earnings.
Excluding items, the company earned $2.15 per share.
Analysts on average had expected earnings of $2.06 per share on revenue of $1.20 billion, according to Thomson Reuters I/B/E/S.
The Marysville, Ohio-based company reiterated its sales and profit outlook for the year. -- Source: Reuters via Yahoo! Finance; Scotts Miracle-Gro warns on margins, shares fall
The disturbing part here is that the firm re-iterated the sales forecast for the year, and a month later this happened (they guided down). That’s an ugly black eye for management. In fact, it’s almost incomprehensible.
On 5-8-2012 we read: “The Marysville, Ohio-based company reiterated its sales and profit outlook for the year.” But today we read: “Scotts Miracle-Gro Co. said it likely will not meet its expected sales growth target this year.”
For the SMG shareholders, this should not sit well… very not well.
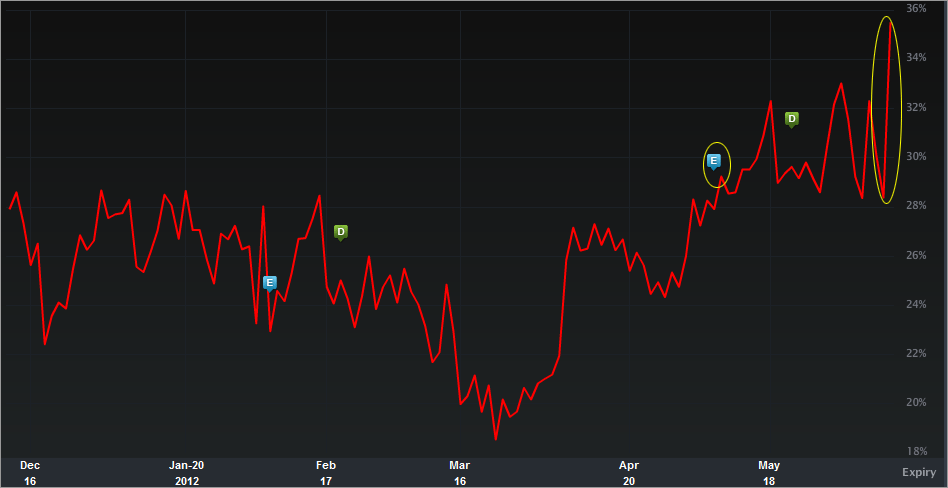
On the vol side, we can see the rise today. The chart is a little deceiving due to the scale. I’ve included the vol chart alone, below – just IV30™ over the last six months.
It’s easier to see the rise today in that chart, as well as the level of the implied after the earnings result. While the level today is a six month high, the 52 wk range in IV30™ is [18.31%, 48.67%], putting today’s level in the 57th percentile (annual). That feels low given the news today and a month ago, no?
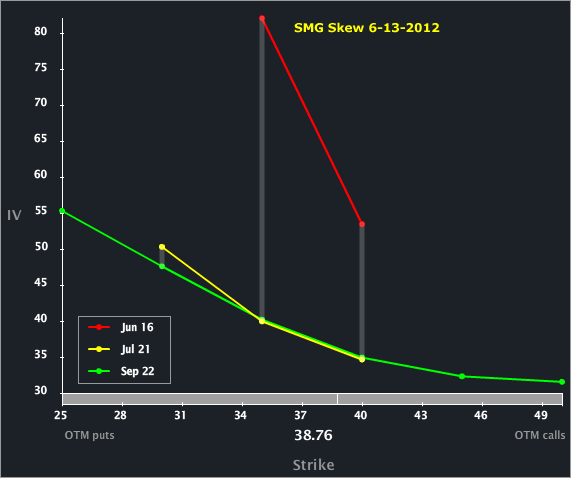
Let’s turn to the Skew Tab to examine the month-to-month and line-by-line vols.
Two things I notice here:
1. The front is obviously super elevated to the back. That makes sense given that we’re 2.5 trading days away from expiry.
2. Jul and Sep lie on top of each other –or in English, the vol levels for Jul and Sep are about the same. The next earnings release for SMG should be in August (so inside Sep but outside Jul). Said differently, the option market reflects as much risk in the Jul options as there are in the Sep options with another earnings release. That sounds about right given the news today and the double-take the firm took on the sales projections.
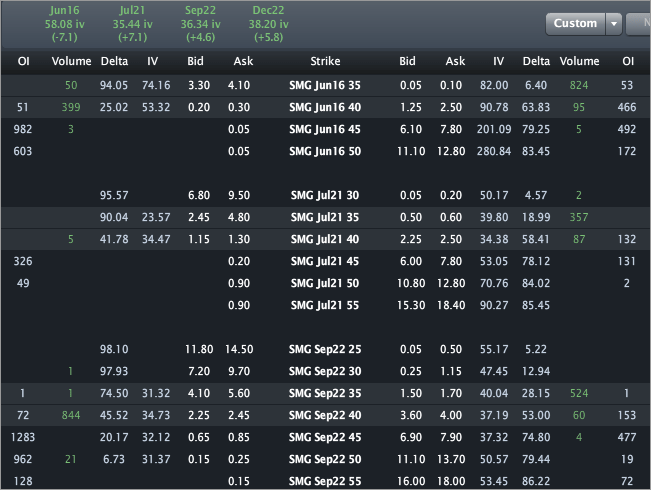
Finally, let’s turn to the Options Tab, for completeness.
I wrote about this one for TheStreet (OptionsProfits), so no specific trade analysis here. Across the top we can see the vols by expiry, namely 58.08%, 35.44% and 36.34%, respectively for Jun, Jul and Sep.
DISCLAIMER: This is trade analysis, not a recommendation.
- English (UK)
- English (India)
- English (Canada)
- English (Australia)
- English (South Africa)
- English (Philippines)
- English (Nigeria)
- Deutsch
- Español (España)
- Español (México)
- Français
- Italiano
- Nederlands
- Português (Portugal)
- Polski
- Português (Brasil)
- Русский
- Türkçe
- العربية
- Ελληνικά
- Svenska
- Suomi
- עברית
- 日本語
- 한국어
- 简体中文
- 繁體中文
- Bahasa Indonesia
- Bahasa Melayu
- ไทย
- Tiếng Việt
- हिंदी
SMG: Another Miss Puts Management's Ability In Question; Vol Spikes
Published 06/14/2012, 03:18 AM
Updated 07/09/2023, 06:31 AM
SMG: Another Miss Puts Management's Ability In Question; Vol Spikes
3rd party Ad. Not an offer or recommendation by Investing.com. See disclosure here or
remove ads
.
Latest comments
Install Our App
Risk Disclosure: Trading in financial instruments and/or cryptocurrencies involves high risks including the risk of losing some, or all, of your investment amount, and may not be suitable for all investors. Prices of cryptocurrencies are extremely volatile and may be affected by external factors such as financial, regulatory or political events. Trading on margin increases the financial risks.
Before deciding to trade in financial instrument or cryptocurrencies you should be fully informed of the risks and costs associated with trading the financial markets, carefully consider your investment objectives, level of experience, and risk appetite, and seek professional advice where needed.
Fusion Media would like to remind you that the data contained in this website is not necessarily real-time nor accurate. The data and prices on the website are not necessarily provided by any market or exchange, but may be provided by market makers, and so prices may not be accurate and may differ from the actual price at any given market, meaning prices are indicative and not appropriate for trading purposes. Fusion Media and any provider of the data contained in this website will not accept liability for any loss or damage as a result of your trading, or your reliance on the information contained within this website.
It is prohibited to use, store, reproduce, display, modify, transmit or distribute the data contained in this website without the explicit prior written permission of Fusion Media and/or the data provider. All intellectual property rights are reserved by the providers and/or the exchange providing the data contained in this website.
Fusion Media may be compensated by the advertisers that appear on the website, based on your interaction with the advertisements or advertisers.
© 2007-2024 - Fusion Media Limited. All Rights Reserved.
