Now I suppose one of the reasons I find these words so touching is because I’m a “Knight” myself, and my roots extend back to medieval England. I’m a hopeless romantic, in spite of all evidence to the contrary, and I’ve long wanted to do well for whomever I am serving.
This desire has been thwarted for a long, long time. Try as I might, through various rounds of QE, it has been exceptionally hard to provide consistent and profitable trading ideas on the short side in a one-way market. I’m a very good chartist – exceptional, some would say – but even the best chartist has profound difficulty turning straw (a QE-obsessed market) into gold.
Having endured countless Fed interventions, I thought our liberation was at hand in late October of last year, when QE was finally ended. It had been an awful, horrible, humiliating road I had been on, and I was so relieved that, for a while at least, the central bank monkeys would be off our back.
But two days – two stinking days – later, Japan came storming in with their own gargantuan buying program, and equities around the world exploded higher. I was absolutely forlorn. This will never end, I told myself. The world’s central bankers will just keep stringing these programs together in perpetuity. The bears will never even have a chance. My talent – my one talent – is now useless.
What an asshole.
And the markets did indeed keep cruising higher for another full six months, topping (as measured by the S&P 500) on May 20 of this year.
But before that happened, I started to notice subtle changes in the market. It didn’t happen immediately after QE3 ended, of course. It took a while. But, starting in 2015, a few things started working again. Charts actually seemed to be getting a little respect by price action. Old techniques I had used for years actually functioned again, yielding profits here and there.
With the aid of perspective, I came to a sweeping, controversial conclusion: that the fake bull market of Bernanke and Yellen had actually ended when 2014 was finished. This declaration met with a few put-downs and cat-calls, but I stood by it. The market, in the broadest terms, changed from bull to bear when 2015 began.
This seems odd to say, since many indexes kept cruising higher, some of them to the highest levels in human history. Indeed, it was only a few weeks ago that the NASDAQ Composite, on July 20th, reached a level that overshadowed even the laughable mania of early 2000. The central bankers, it surely seemed, had won.
Those of us pointing out the asset bubbles around the world, particularly the one driven by completely clueless, uneducated citizens in China, were laughed out of the room. MarketWatch (which is kind of the Internet equivalent of CNBC) had front-page headlines about how you should “Ignore the Bubble in Bubble Talk”.
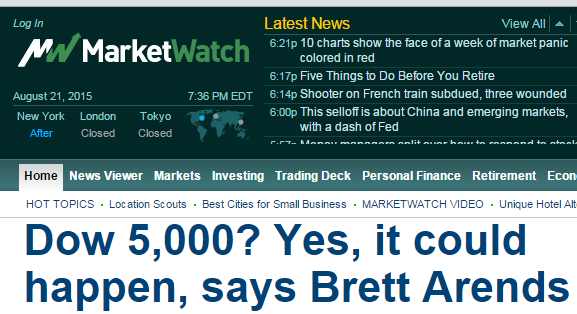
Well, MarketWatch isn’t exactly known for sticking to its guns. It’s really more of a weather vane as to what’s happened over the past 24 hours or so. Thus, after Friday’s close, they were singing a different tune:

When you see this kind of bluster on a site as regrettable as MarketWatch, you can have some confidence that the “crash” everyone seems to be predicting for Monday isn’t terribly likely.
I’m more inclined to agree with what Tom McClellan, a widely-respected chartist and technician, said today, reported here on Slope by our beloved BigOldEd:
“So my expectation is for a relief rally which will set up for the more significant decline in September and beyond. We won’t get out of the downtrending phase until early April. And you can bet that by the time we get to April, the big themes in the presidential election campaigns will switch from immigration and new taxes to instead being about how we can get the economy out of the recession we are now entering.”
Spot on, Tom! Spot on!
My road map for the months ahead is along these lines:
- The initial drop, which I’ve predicted in great detail both here and on TastyTrade, has already transpired gloriously. Many of you have made buckets of cash on it.
- Next (I hope!) is a relief rally. I will show a chart below which provides a guide to what I think will happen more specifically.
- Then the market will resume its weakness with more force, pushing well past the lows we saw this week.
- At that point, Janet Yellen will have precisely the rationale she has required (and probably ordered up a la carte from Goldman Sachs) to roll out QE4, which will cause the last meaningful rally for years. We will not reach new highs, but this rally could sustain itself for a few months.
- And then, thank God and Jesus in heaven, the entire global financial system will plummet into a hellish nightmare, and you will have worldwide political chaos and universal fury from the citizens who have been duped by our friends at the Fed, Goldman Sachs (NYSE:GS), and the people they represent.
Of course, this will make for an even more interesting presidential election cycle than you might expect in 2016, wouldn’t you say?
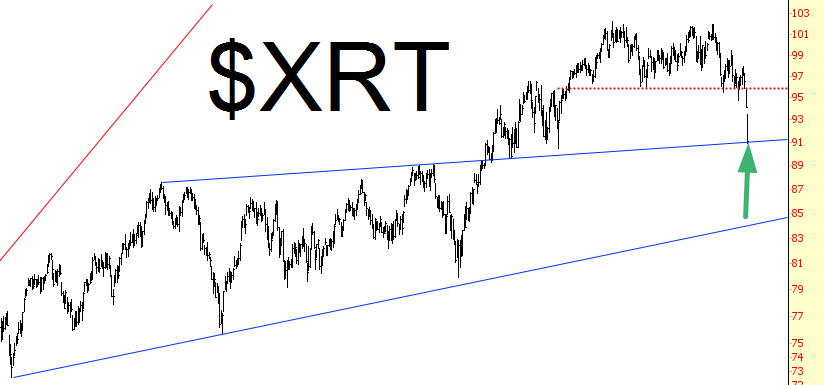
As I mentioned, the market has followed through fantastically with the distribution tops I’ve been pointing out again and again (start with SPDR Barclays (LONDON:BARC) High Yield Bond (NYSE:JNK), repeatedly, on Slope Plus, and then with the likes of SPDR Dow Jones Industrial Average (NYSE:DIA) and SPDR S&P Retail (NYSE:XRT)). For example, retail completely nailed its target today (oh, and I just noticed there’s a dollar sign there, which the symbol doesn’t have – sorry).

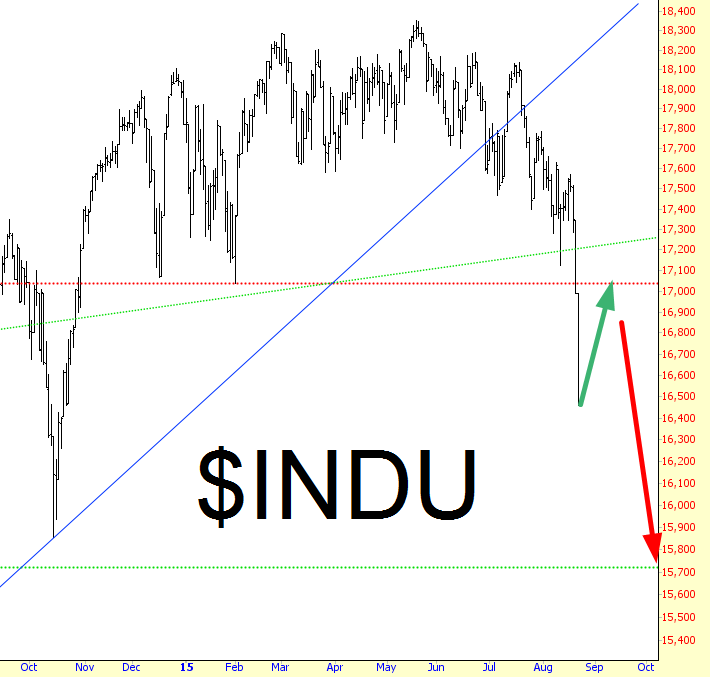
But here’s what I see for the market in general. Below is the Dow 30. I expect (and, again, hope – – because, God forgive me, I’m actually long five ETFs in size right now) we get a meaningful relief rally, carrying us up to the psychologically-important 17,000 level. At that point, please don’t be anywhere between me and my keyboard, because I am going to be shorting anything with a ticker symbol in size.

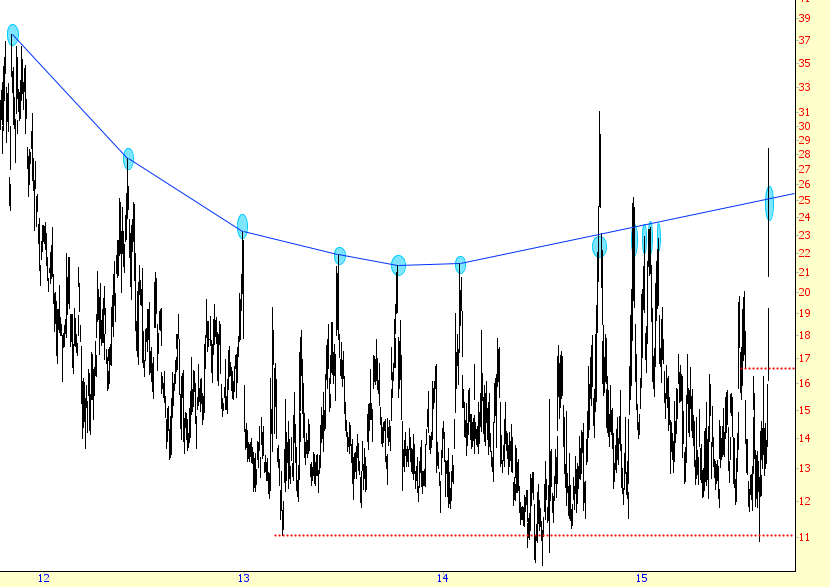
Now some folks have wondered why I covered anything at all today. Let me assure you, I would have been better off if I hadn’t! (And if we crash on Monday, I’ll be even more upset than I am right now, although please note I am still short 55 different stocks). I can answer your question with one chart:

I pledged to you (and myself) for month after month that if the VIX ever reached “about 24 or so” that I’d take that as my signal to take profits. This seemed like it would never happen. Hell, only earlier this month, the VIX reached a 10-handle! But today is ripped higher, getting as lofty as 28.38, and I honored my pledge.
The $17,000 extra profit in my account had I done absolutely nothing would be welcome, to be sure. But as we saw on Wednesday, the market can rip absolutely out of the blue with great force, and if I had ignored my pledge, and the market did indeed soar higher – – – well, you’d be reading a very different post right now (one of regret and shame, as opposed to muted victory).
Thank you for taking the time to read this. I hope you got something out of it. I think I did. And I think I’ve made plan what I anticipate in the months ahead.
Best of luck to you and me both. We are heading into interesting times, my friends.
