Skyworks Solutions, Inc. (SWKS) offers analog and mixed signal semiconductors. Skyworks offers custom linear products supporting automotive, broadband, cellular infrastructure, energy management, industrial, medical, military and cellular handset applications.
This is an order flow and vol note -- in particular a skew shift. SWKS traded 13,032 contracts on total daily average option volume of just 5,887. Calls traded on a 7.4:1 ratio with the heavy action in Sep 29 and 30 calls. The The Stats Tab and Day's biggest trades snapshots are included (below).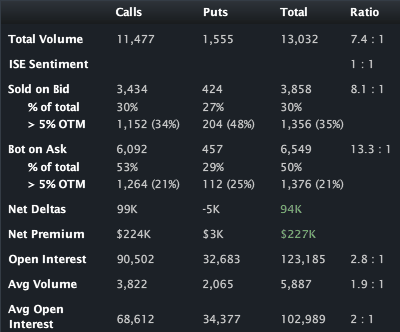
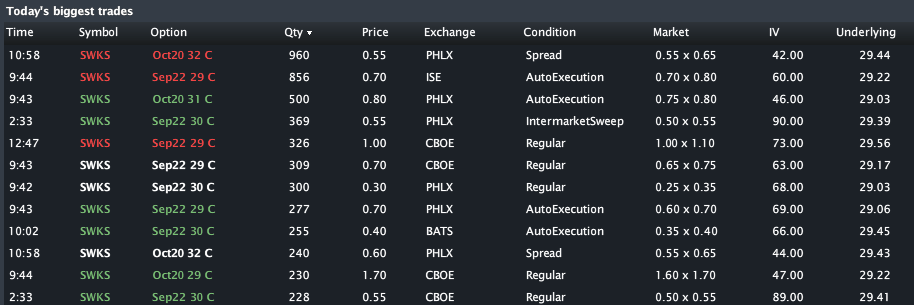
The Options Tab (below) illustrates the existing OI in the Sep 29 and 30 calls. I note in particular the size of the interest in the Sep 30 calls which appears to be long (IMHO). The action today in the Sep 30's also looks long, so this feels like new opening long interest. The existing interest in the Sep 29 calls also looks long to me, but the flow today is a bit ambiguous -- maybe two-sided. In any case, the Sep 30 line looks like that's where the action has been and was today -- and it all looks long to me.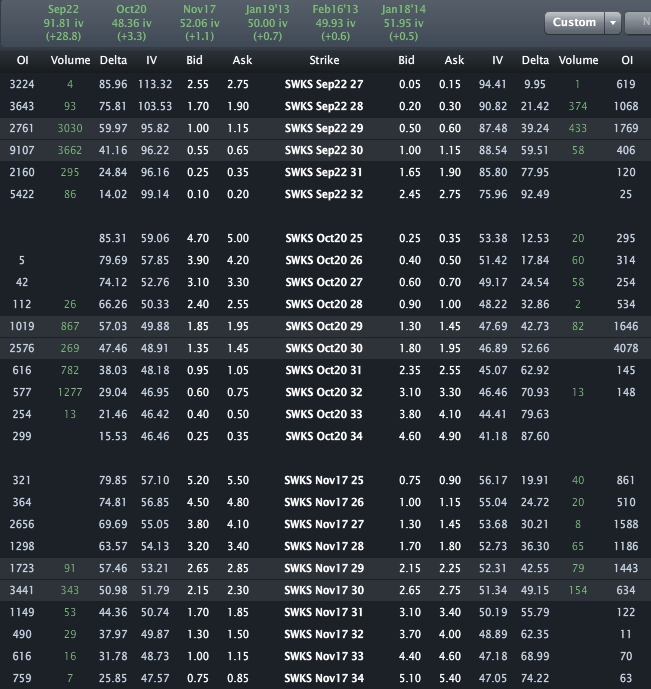
The Skew Tab snap (below) illustrates the vols by strike by month.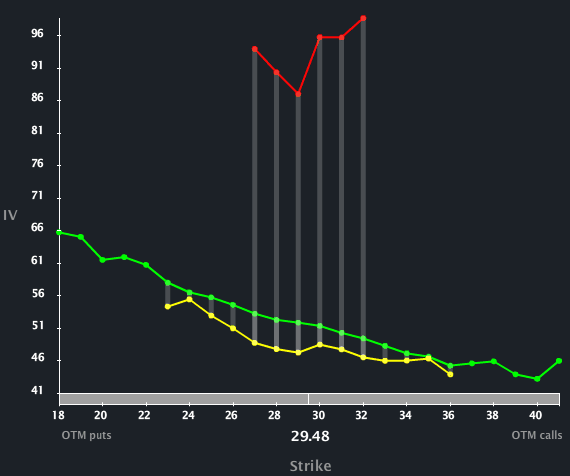
The red curve represents Sep, yellow is Oct and green is Nov. We can see how elevated the vol is in Sep. In fact, looking back to the Options Tab (across the top), we can see that Sep vol popped 28.8 vol points,while Oct rose just 3.6 vol points. Not only do we see that vol diff reflected in the skew, we can see the shape of the Sep skew bending up to the OTM calls -- starting with the Sep 30's.
I've included the Skew tab from exactly a week ago, below.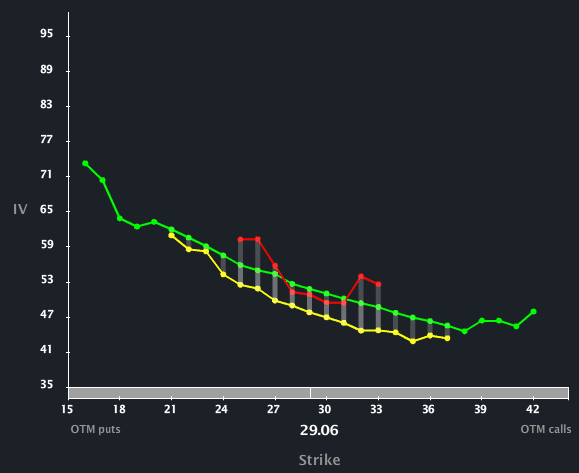
Note how different the skew was back then. Sep vol was below Oct and there wasn't really any upside skew bend to speak of. The action in the last several trading days, today most notably, has changed the term structure and the skew shape.
Finally, the Charts Tab (six months) is below. The top portion is the stock price, the bottom is the vol (IV30™ - red vs HV20™ - blue vs HV180™ - pink).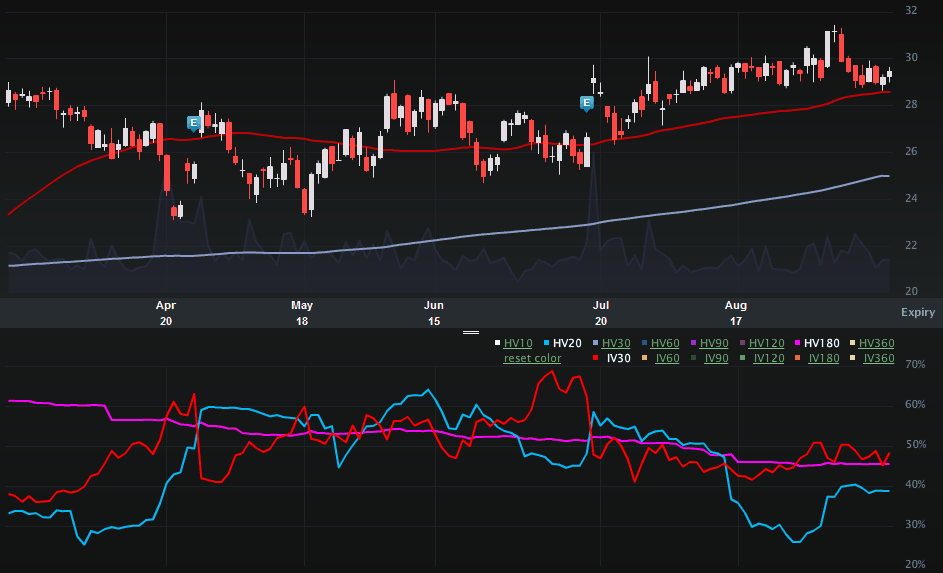
On the stock side we can see a rather lazy chart -- not too volatile. On the vol side we can see the slight move today in the implied and it is now trading above both the short-term and long-term historical realized vols.
Ultimately, this isn't even an IV30™ story -- it's about the Sep options, order flow and skew. The bets are in that something to the upside is coming inthe very near-term. Just to add one last bit of info, the stock volume today was below the daily average -- so the high option volume was not all hedged with stock.
DISCLAIMER: This is trade analysis, not a recommendation
- English (UK)
- English (India)
- English (Canada)
- English (Australia)
- English (South Africa)
- English (Philippines)
- English (Nigeria)
- Deutsch
- Español (España)
- Español (México)
- Français
- Italiano
- Nederlands
- Português (Portugal)
- Polski
- Português (Brasil)
- Русский
- Türkçe
- العربية
- Ελληνικά
- Svenska
- Suomi
- עברית
- 日本語
- 한국어
- 简体中文
- 繁體中文
- Bahasa Indonesia
- Bahasa Melayu
- ไทย
- Tiếng Việt
- हिंदी
Skyworks Solutions: Order Flow Pushes Skew; Two Day Bets Are In
Published 09/20/2012, 06:24 AM
Updated 07/09/2023, 06:31 AM
Skyworks Solutions: Order Flow Pushes Skew; Two Day Bets Are In
3rd party Ad. Not an offer or recommendation by Investing.com. See disclosure here or
remove ads
.
Latest comments
Install Our App
Risk Disclosure: Trading in financial instruments and/or cryptocurrencies involves high risks including the risk of losing some, or all, of your investment amount, and may not be suitable for all investors. Prices of cryptocurrencies are extremely volatile and may be affected by external factors such as financial, regulatory or political events. Trading on margin increases the financial risks.
Before deciding to trade in financial instrument or cryptocurrencies you should be fully informed of the risks and costs associated with trading the financial markets, carefully consider your investment objectives, level of experience, and risk appetite, and seek professional advice where needed.
Fusion Media would like to remind you that the data contained in this website is not necessarily real-time nor accurate. The data and prices on the website are not necessarily provided by any market or exchange, but may be provided by market makers, and so prices may not be accurate and may differ from the actual price at any given market, meaning prices are indicative and not appropriate for trading purposes. Fusion Media and any provider of the data contained in this website will not accept liability for any loss or damage as a result of your trading, or your reliance on the information contained within this website.
It is prohibited to use, store, reproduce, display, modify, transmit or distribute the data contained in this website without the explicit prior written permission of Fusion Media and/or the data provider. All intellectual property rights are reserved by the providers and/or the exchange providing the data contained in this website.
Fusion Media may be compensated by the advertisers that appear on the website, based on your interaction with the advertisements or advertisers.
© 2007-2024 - Fusion Media Limited. All Rights Reserved.
