Get 40% Off
💰 Buffett reveals a $6.7B stake in Chubb. Copy the full portfolio for FREE with InvestingPro’s Stock Ideas toolCopy Portfolio

Similarities To 1929, 1987, 2000 & 2007 In Play

Published 03/02/2018, 07:06 AM
Updated 07/09/2023, 06:31 AM
DJI
-

The 2-pack below looks at the Dow from two different time frames. 100-year look back on the left and 35-year look back on the right. As you can see the Dow is in a very strong and well defined rising bull trend! Nothing of late has changed that!!! The strong rally since the 2009 lows has the Dow back at the top of this quality rising channel, attempting a breakout.

The left chart reflects that momentum is at levels seldom seen in the past 100-years. Other key times momentum was this high was back in 1929, 1987, 2000, 2007.

Joe Friday Just The Facts Ma’am- Bulls prefer to see breakouts, not selling getting started at (1)!
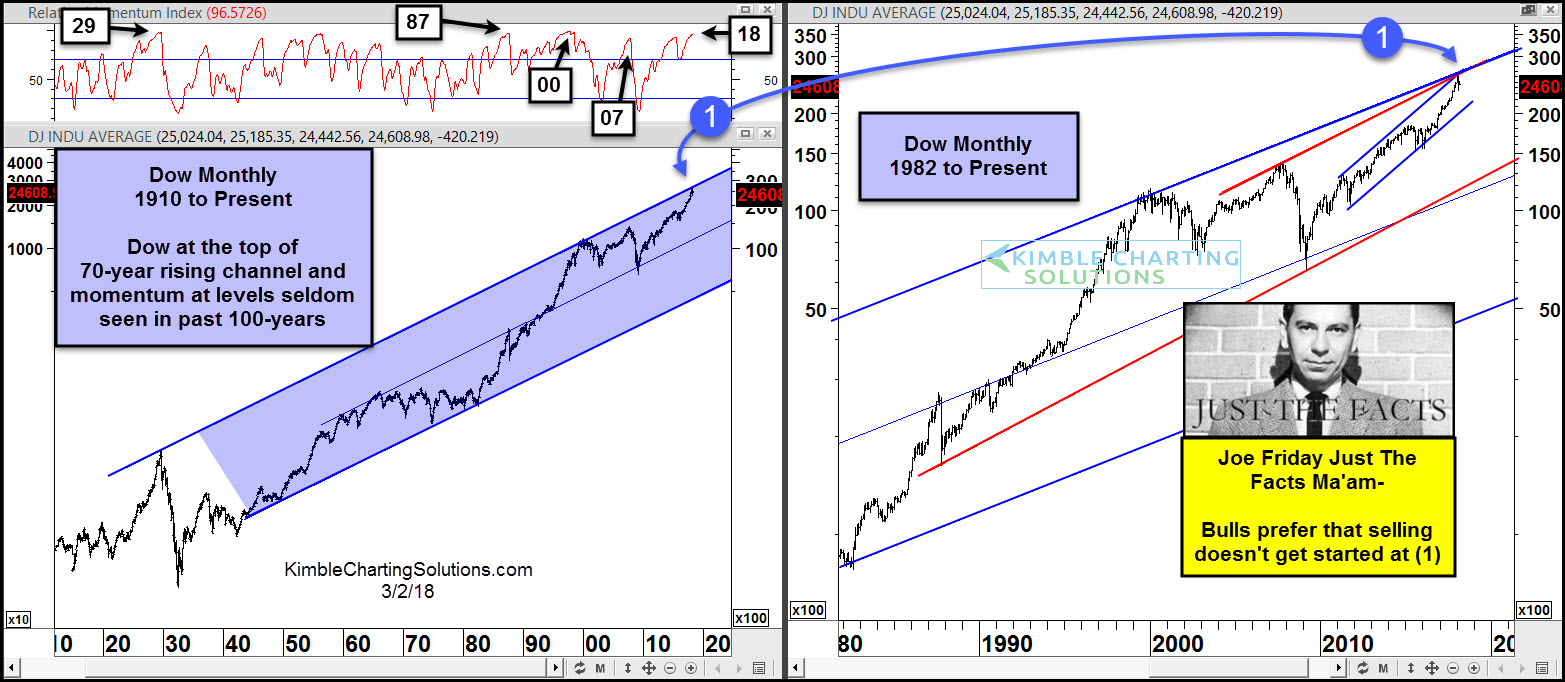
Dow Monthly 1910 To Present

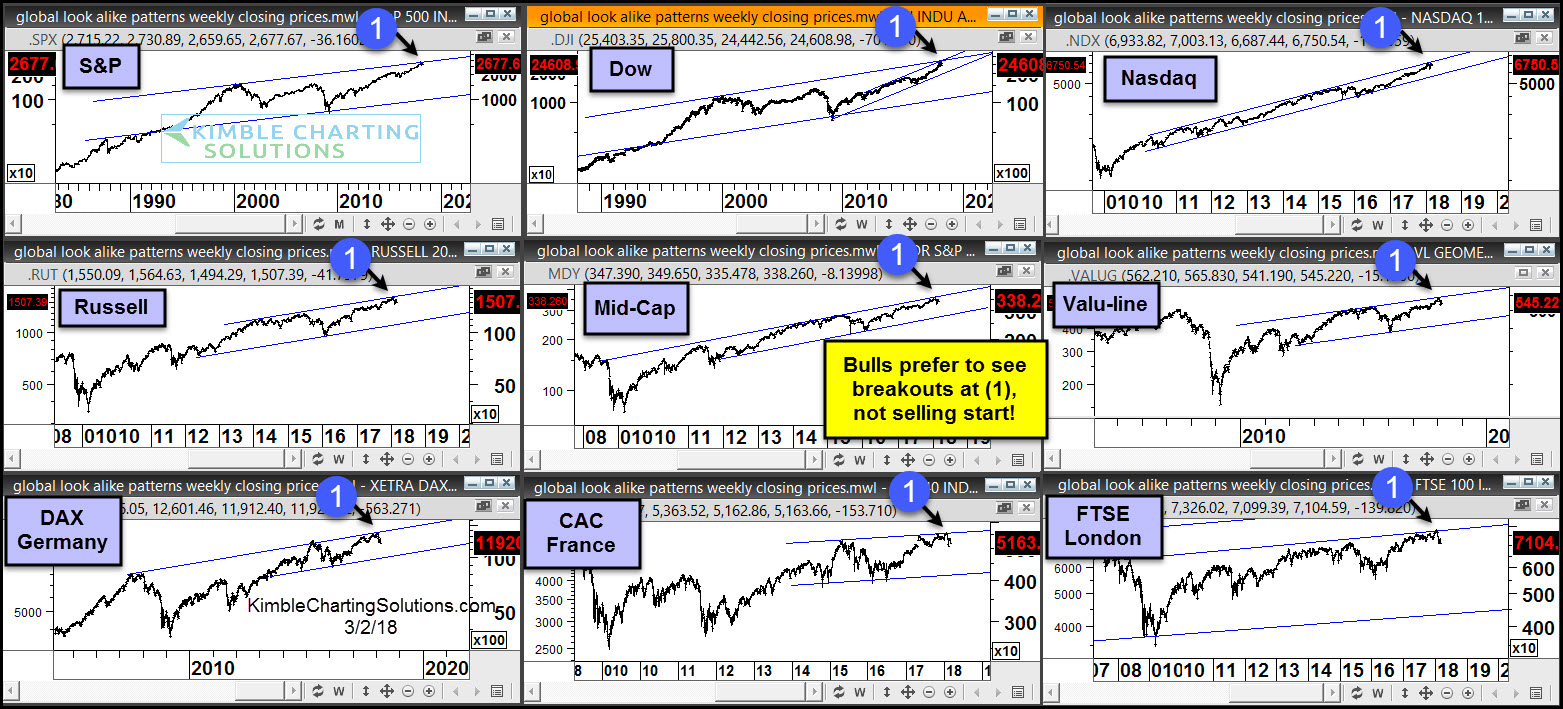
The 9-pack below looks at key stock indices around the world-
SPX

The 9-pack above reflects the world is highly correlated (Look Alike Patterns)!

Joe Friday Just The Facts Ma’am- Bulls prefer to see breakouts, not selling getting started at (1)!

If breakouts take place at each (1), it would be super bullish news as markets around the world remain in uptrends!

Latest comments

Risk Disclosure: Trading in financial instruments and/or cryptocurrencies involves high risks including the risk of losing some, or all, of your investment amount, and may not be suitable for all investors. Prices of cryptocurrencies are extremely volatile and may be affected by external factors such as financial, regulatory or political events. Trading on margin increases the financial risks.
Before deciding to trade in financial instrument or cryptocurrencies you should be fully informed of the risks and costs associated with trading the financial markets, carefully consider your investment objectives, level of experience, and risk appetite, and seek professional advice where needed.
Fusion Media would like to remind you that the data contained in this website is not necessarily real-time nor accurate. The data and prices on the website are not necessarily provided by any market or exchange, but may be provided by market makers, and so prices may not be accurate and may differ from the actual price at any given market, meaning prices are indicative and not appropriate for trading purposes. Fusion Media and any provider of the data contained in this website will not accept liability for any loss or damage as a result of your trading, or your reliance on the information contained within this website.
It is prohibited to use, store, reproduce, display, modify, transmit or distribute the data contained in this website without the explicit prior written permission of Fusion Media and/or the data provider. All intellectual property rights are reserved by the providers and/or the exchange providing the data contained in this website.
Fusion Media may be compensated by the advertisers that appear on the website, based on your interaction with the advertisements or advertisers.
© 2007-2024 - Fusion Media Limited. All Rights Reserved.