While December was a horrible month for the broader markets, that wasn’t the case for the precious metals. As the Dow Jones and S&P 500 Indexes suffered the worst December since the Great Depression, the silver price enjoyed quite a healthy rally. The notion of rising precious metals prices during a market selloff ran counter to most analysts who forecasted falling asset values across the board.
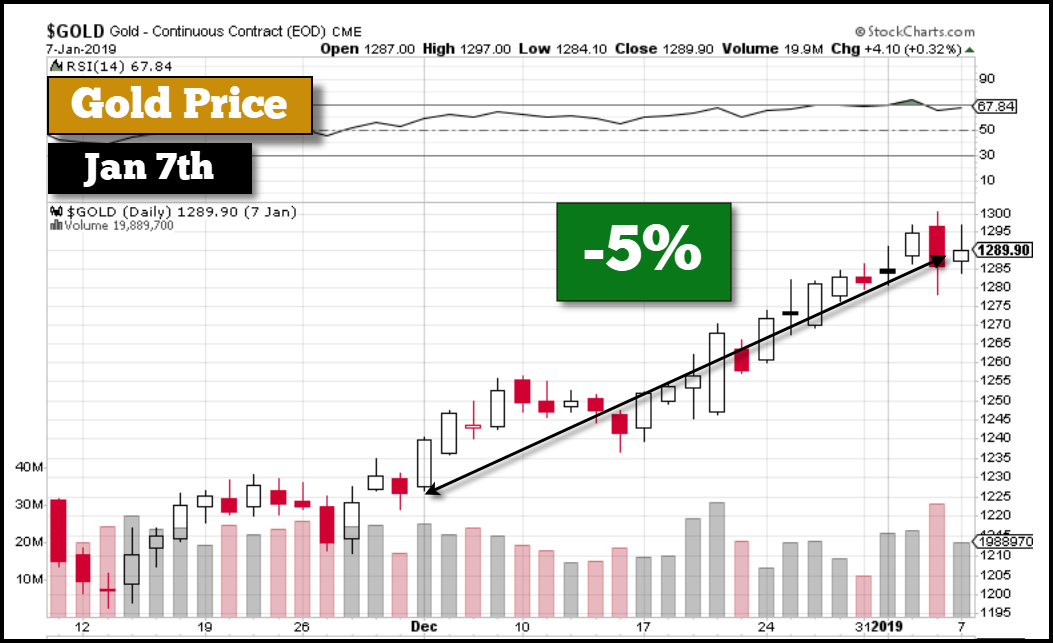
However, that’s exactly what took place in December. I stated, since the beginning of 2018, that when the markets really started to decline the precious metals would likely disconnect and rally higher. Over the past month, the silver price jumped by 10% and gold 5%, while most of the broader indexes, base metals, and energy suffered declines.
For example, the Dow Jones Index fell 9% since December 1st, even though it has rallied from its low on Christmas Eve:
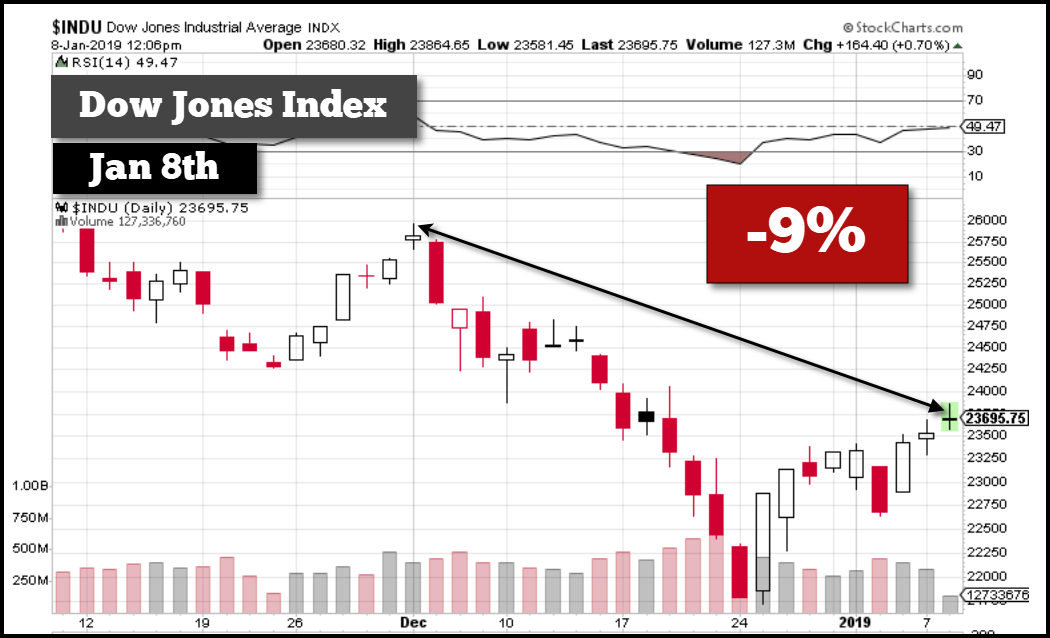
At its low on Christmas Eve, the Dow Jones Index fell a stunning 16% in a little more than three weeks. Currently, the Dow is attempting to retest its 25 Day moving average (MA) and the 24,000 resistance level that I have shown in previous charts. If we look at the graph below, we can see that the Dow finally touched the 25 Day MA today:
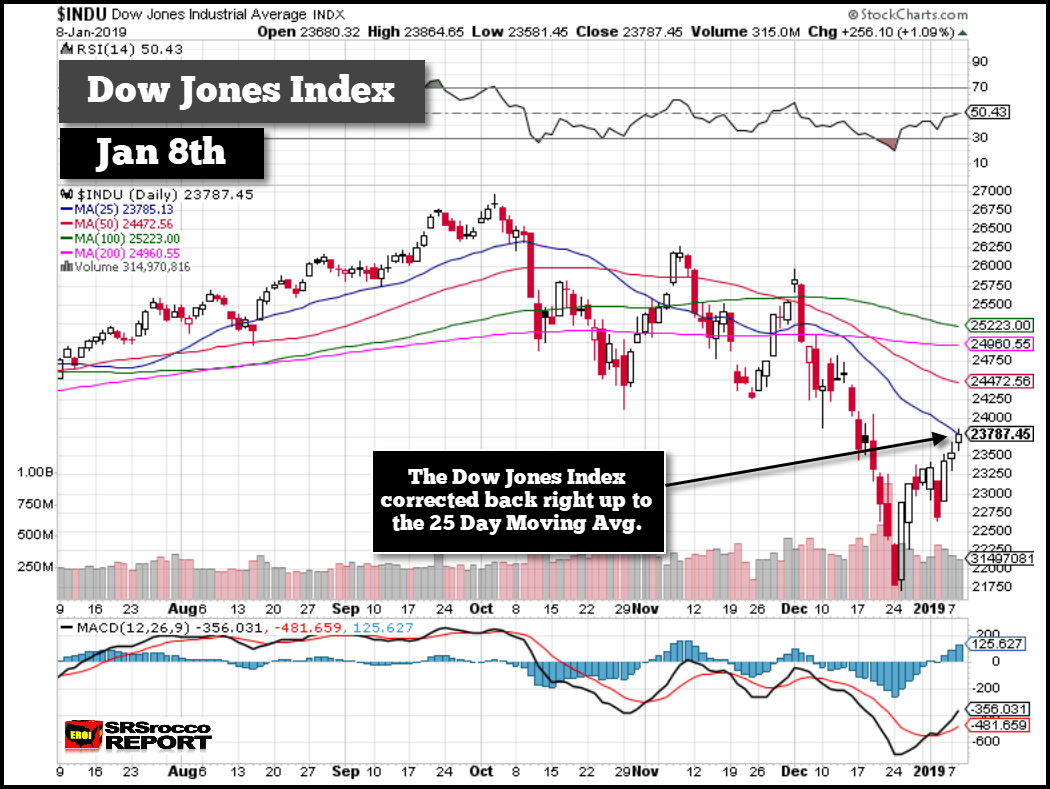
It will be interesting to see what the Dow does tomorrow, but at some point, the broader markets will reverse and continue to sell off.
I must say, watching Intra-Day trading of the markets, stocks, metals, commodities, and energy has been quite eye-opening. Yes, I still follow the fundamentals as they are the true factors that guide the markets, but technical analysis provides us a “crystal ball” on price trend movements. I will explain at the end of the article, but let’s look at the next following charts.
The oil price has also been falling along with the broader markets. Even though the U.S. West Texas Intermediate oil price peaked at the beginning of October, it dropped another 8% over the past month:
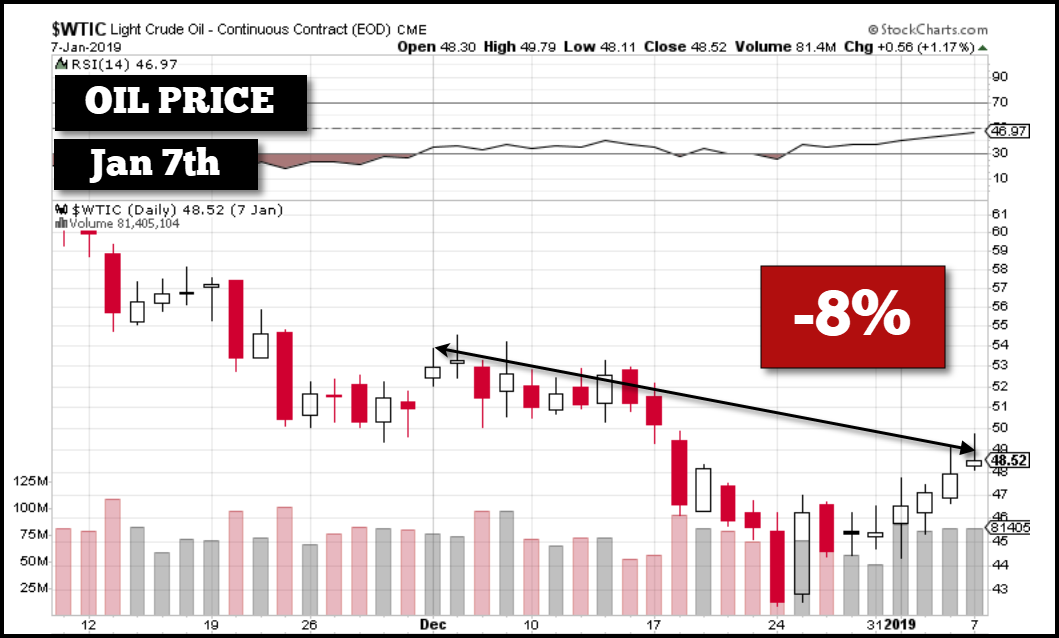
Now, it is quite amazing how the oil price also fell to its low along with the Dow Jones on Christmas Eve and then shot up higher the next trading day. I believe the oil price will attempt to move back up to $52 before reversing lower.
Please note, these charts were done early today before the market close, so the metals and energy prices are reflective of January 7th (Monday) trading.
The next chart is quite surprising because it usually trends with silver. Because copper is the king base metal and a major indicator of the industrial sector, it provides an important gauge of the health of the economy. The silver and copper prices tend to move together as they are both industrial metals. However, the copper price has fallen 7% since December 1st while silver rose by 10%:
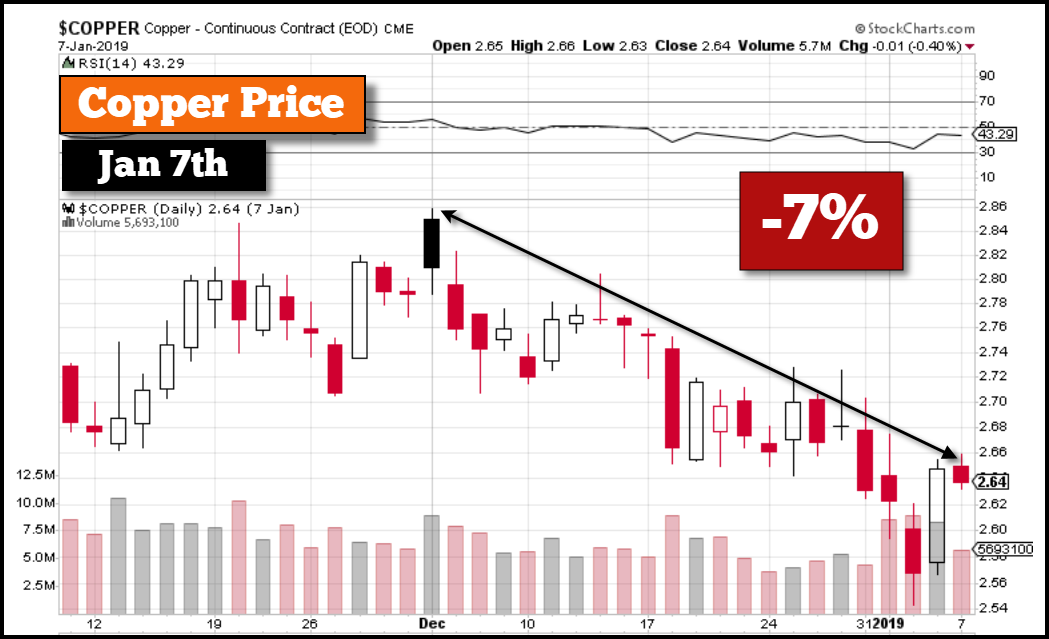
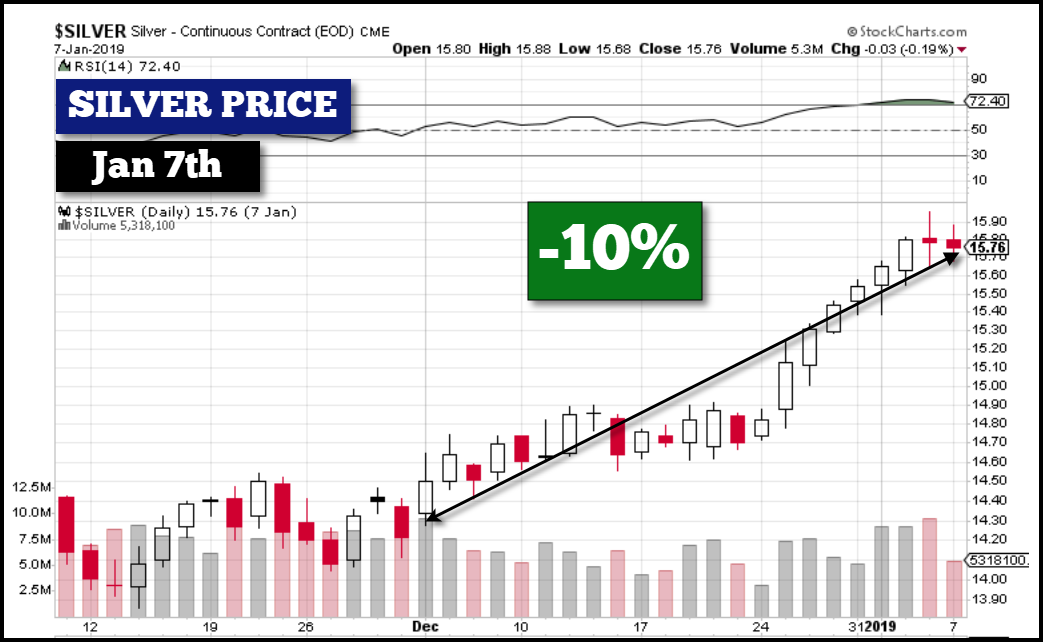
What a disconnect? As I mentioned, the majority of technical analysts forecasted that the precious metals would fall with the broader markets, but as we can see, quite the opposite took place. While gold’s increase of 5% over the same period was half that of silver, at least it also outperformed the majority of assets in the market:
While the precious metals have done relatively well compared to most other assets this past month, I believe we are just seeing the beginning stages of much higher gold and silver prices over the next few years. The broader markets are just beginning their massive correction lower even though some analysts are suggesting the BOTTOM is in.
How on earth can the bottom of the Dow Jones Index be in when it hasn’t even fallen back to its 50 Month MA (BLUE LINE)?
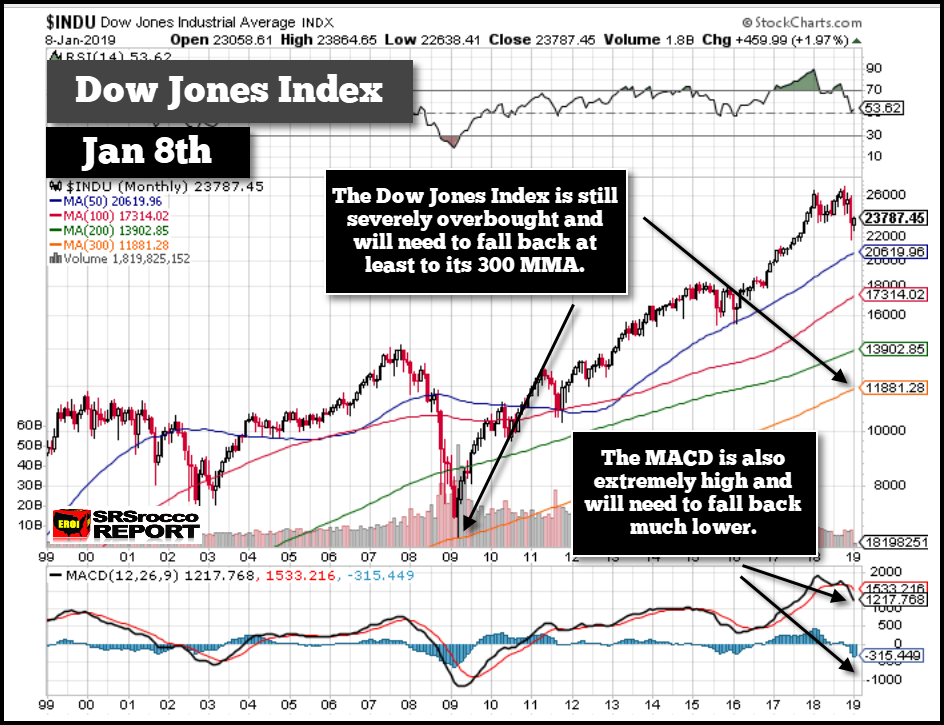
As I have mentioned in previous articles and videos, the Dow will likely fall back at least to its 300 MMA (ORANGE LINE). When the Dow starts ripping down through its lower moving averages that is when fear will begin to really motivate investors into gold and silver.
Revealing The Crystal Ball Of How The Markets Trade
The reason I have been adding charts and technical analysis in my work over the past few months is that I have become amazed at how the markets trade. By studying INTRA-DAY TRADING, I now understand more of the mystery behind price movements in stocks, commodities, metals, and energy.
Now, what happens on an Intra-day chart also takes place on a daily, weekly and monthly chart. They ALL FOLLOW technical levels. When you understand what takes place intra-day, you can even understand what happens over a more extended period.
I say it’s essential to start with the Intra-day (1,2,5,15,30 minute charts) trading because you can watch it take place right in front of you. If you actually view a 1-minute chart and how the tickers move up and down off technical levels, then you can translate that to long term daily, weekly and monthly charts.
For example, I have been using the Intra-day technical levels to understand how stocks trade. When you have a good idea when a stock price peaks or is at a low, then you can make a more confident trade or investment. Today, I was focused on AMD – Advanced Micro Devices (NASDAQ:AMD). AMD is a good stock to trade because it has a great deal of volume and price movement.
Here is a chart of AMD with 5-minute candlestick tickers:
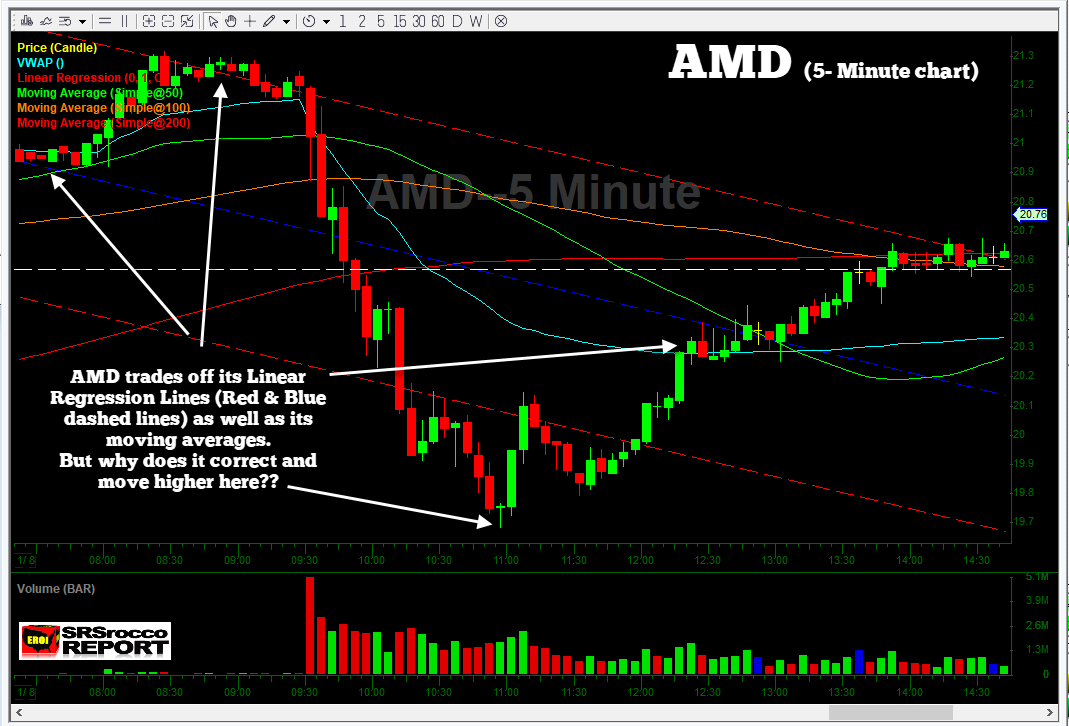
As we can see, AMD traded off its Linear Regression Lines (Blue & Red dashed lines) and moving averages. However, AMD finally bottomed and moved higher about 11 am. Why did AMD bottom at 11 am, shown by the arrow and move higher? There we no moving averages at that level.
To be able to spot when a stock reverses, we must look at many different chart intervals. I use StockCharts to provide me with additional moving averages and clues to when a stock price will reverse. The chart below is a 1-hour chart (each ticker is 1-hour), and the chart has twenty days trading. The red highlighted area is trading today (January 8th):
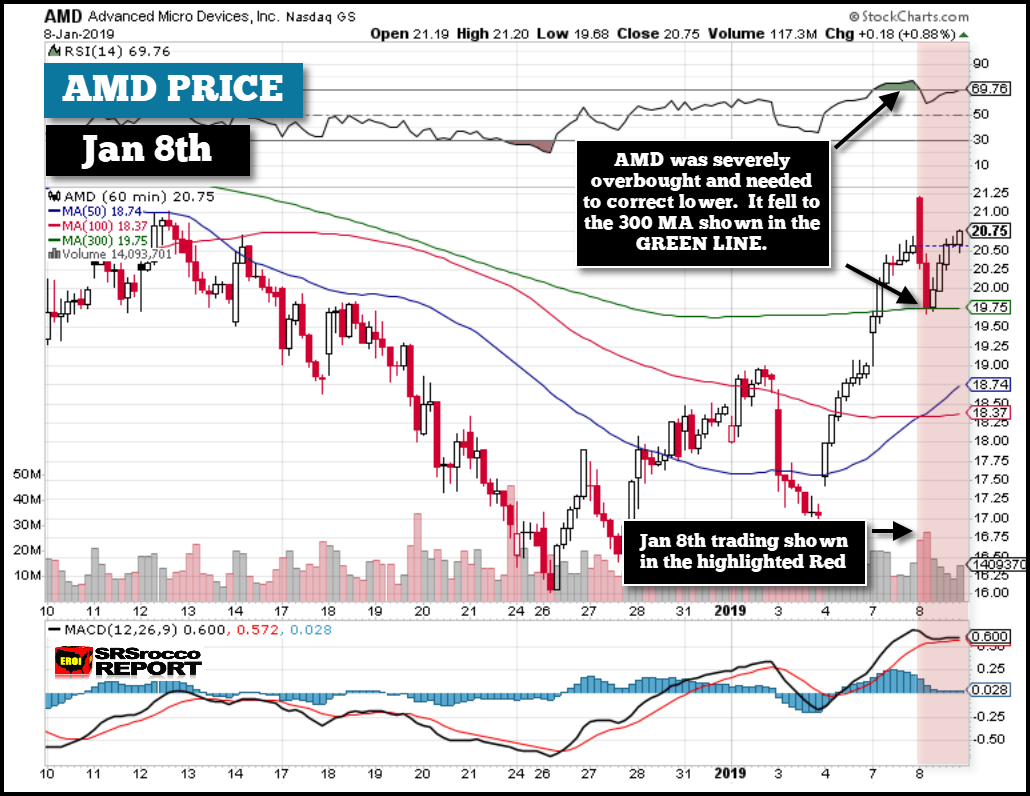
AMD bounced higher on Jan 4th and 7th with no real correction. By the end of trading on Jan 7th, AMD was becoming overbought. You can see that by the high RSI reading in GREEN. You will also notice that AMD was oversold the day after Christmas (Dec 26th) when the RSI went into the RED.
I placed a short trade (want the price to go lower) early this morning on AMD and covered as it sold off, shown in the large red candlesticks. However, I wanted to know how far AMD might fall before it would reverse. Of course, there are no guarantees in trading or investing, but nothing goes up or down in a straight line. Stocks correct up and down off technical levels ALL DAY LONG.
Because the first chart did not provide me with some sort of technical support level, I used my StockCharts to give me a pretty good idea that AMD would fall to that GREEN LINE moving average. And that is precisely where AMD reversed.
I share this because the markets and traders use these technical levels to determine price trends. When you understand these price trends, then you have more a crystal ball in trading and investing in the markets. This will become very handy when knowing when to invest in precious metals or mining stocks.
