Whilst silver had a good week last week, outperforming gold and rising to multi-month new high, it looks like that may have been its “swan song” for a while. It looks quite positive at first sight on its latest 6-month chart with the new high and moving averages starting to swing into a more positive alignment, but once you “look under the hood” you quickly realize things are not so good at all.
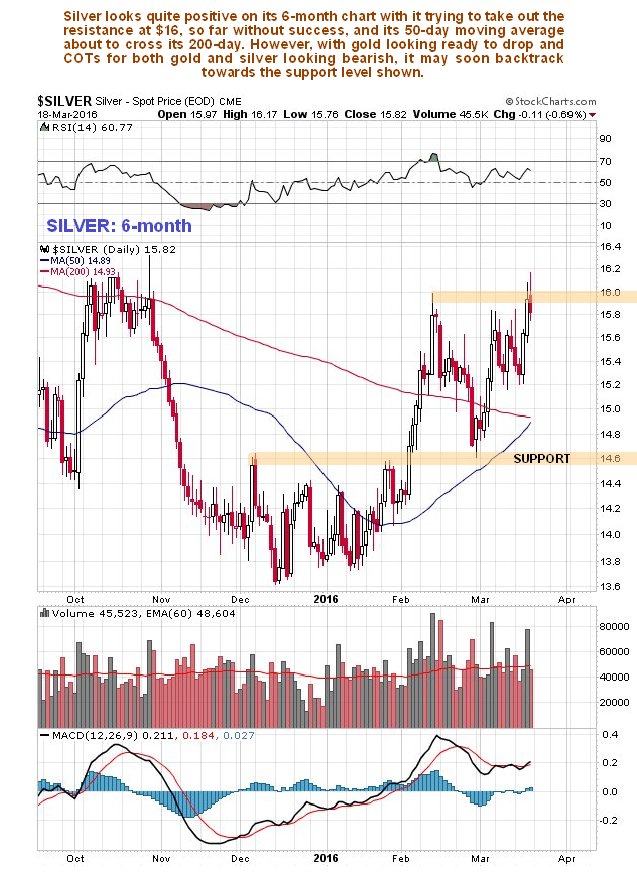
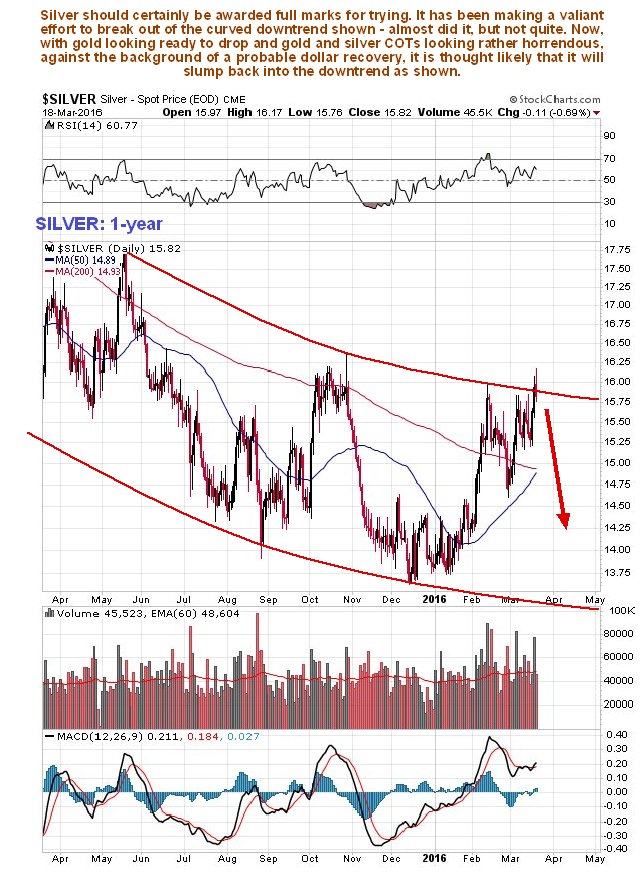
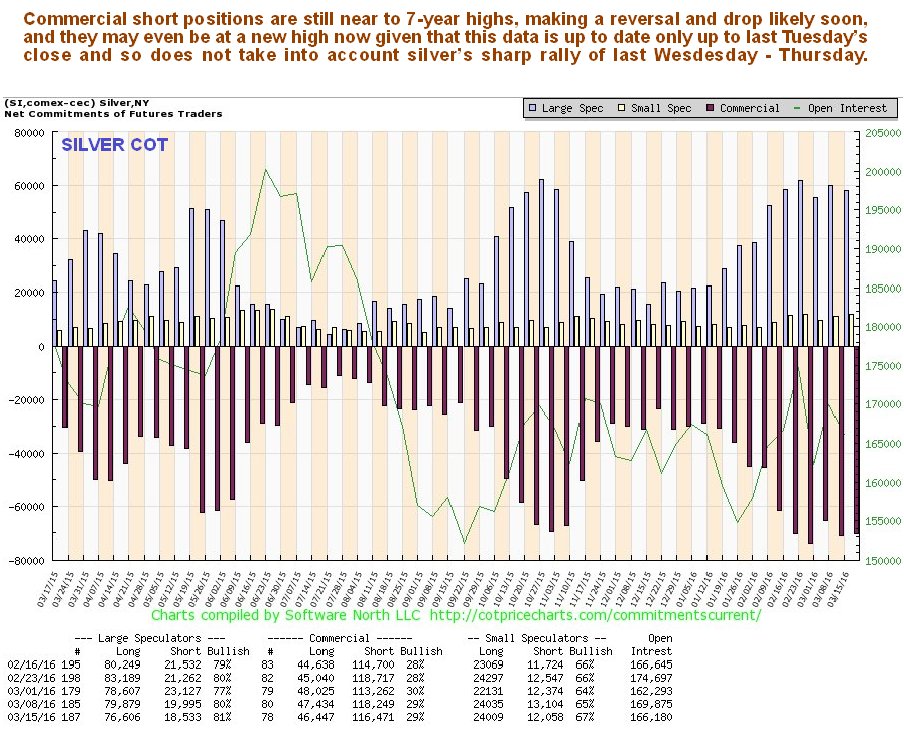
The 1-year chart does not look so hot. It shows silver trying to break out above the upper boundary of a curved downtrend, and not quite succeeding, thus making it vulnerable to slumping back across the channel again. The latest COT chart, which goes back a year, is placed beneath the 1-year silver chart for direct comparison. As we can see it looks pretty horrendous, with Commercial short positions up near to 7-year highs, which greatly amplifies the risks of silver now going into retreat again.
Click on chart to popup a larger clearer version.
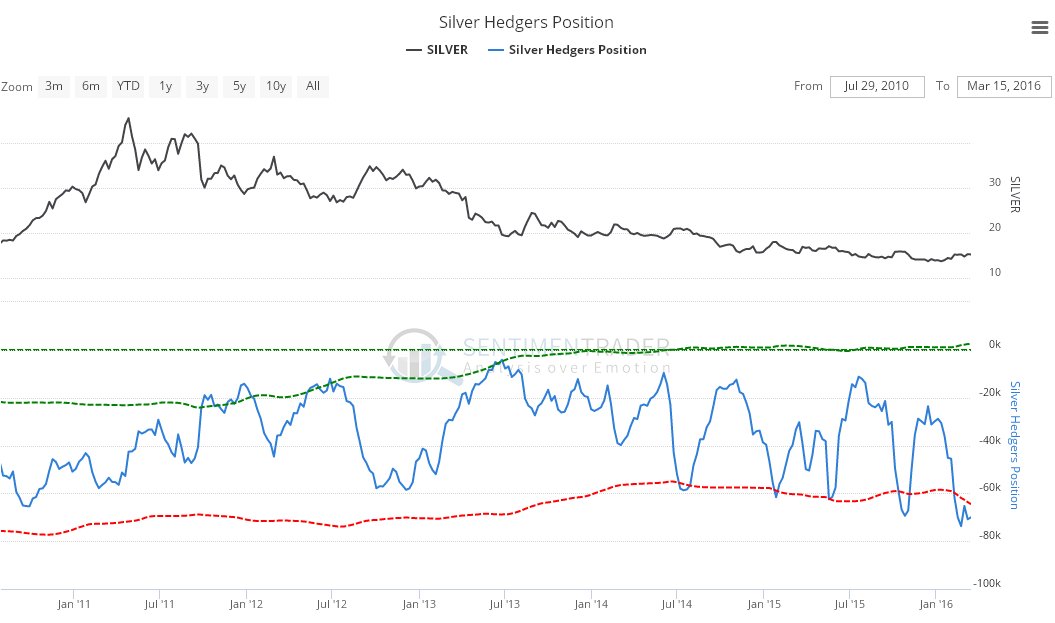
The long-term Hedgers chart, a form of COT chart, looks downright awful and flat out bearish…
Click on chart to popup a larger clearer version.
Chart courtesy of www.sentimentrader.com
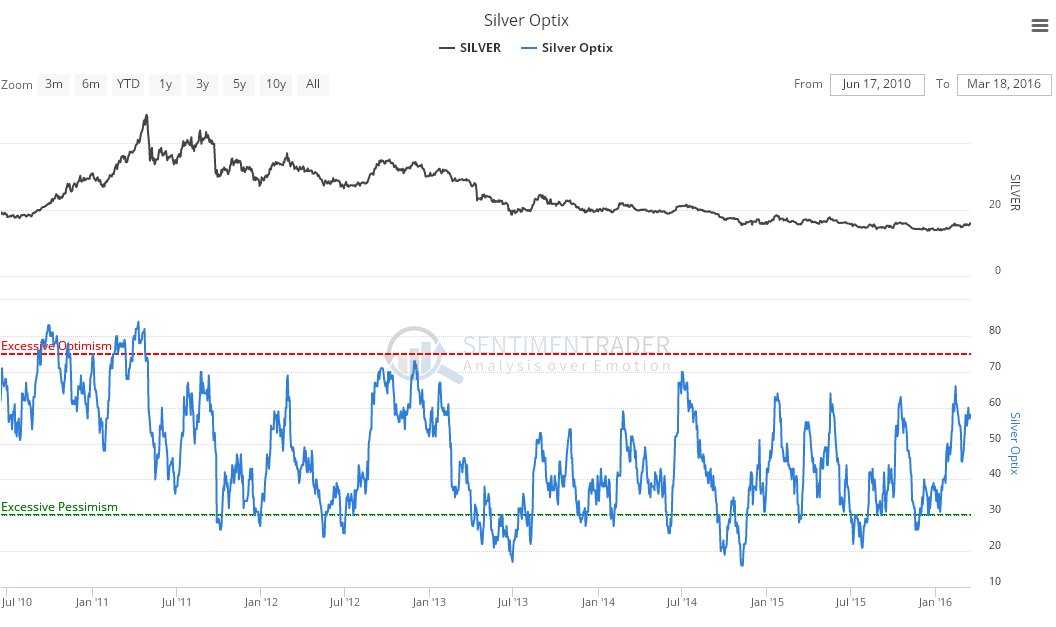
The latest silver Optix, or optimism chart, looks much less threatening. It is in middling ground and in itself does not give us much clue what to expect one way or the other – we will have to go on other factors, which we are.
Click on chart to popup a larger clearer version.
Chart courtesy of www.sentimentrader.com
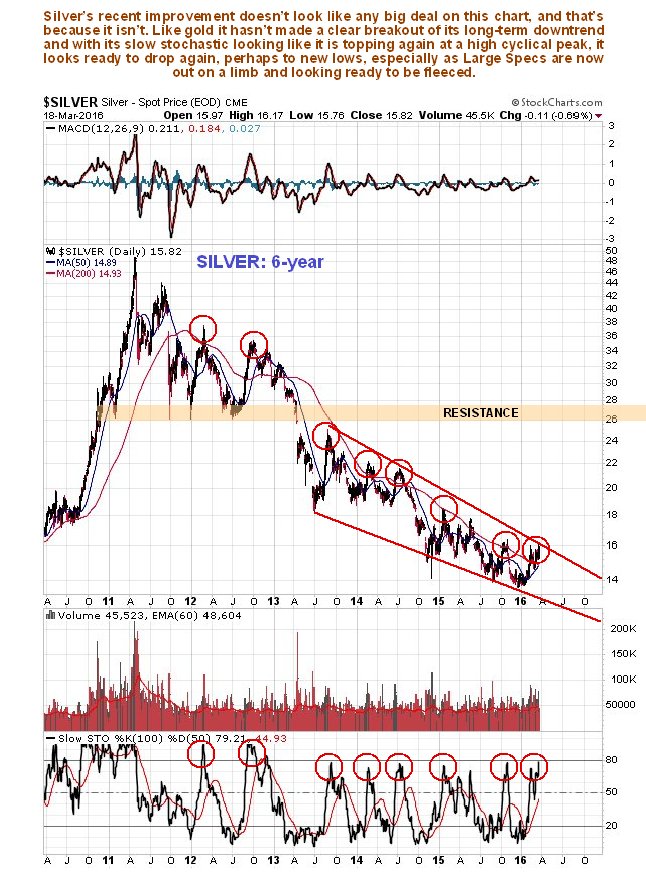
The 6-year chart quickly brings us right down to earth, it shows that silver has made less of an attempt to break out of its long-term downtrend than gold has. It is near the top of it and with its slow stochastic rolling over at a high cyclical peak, looks set to drop back again, possibly to new lows, and this risk is exacerbated by the now decidedly bearish looking COTs, which we just looked at, and the prospect for a near-term dollar rebound.
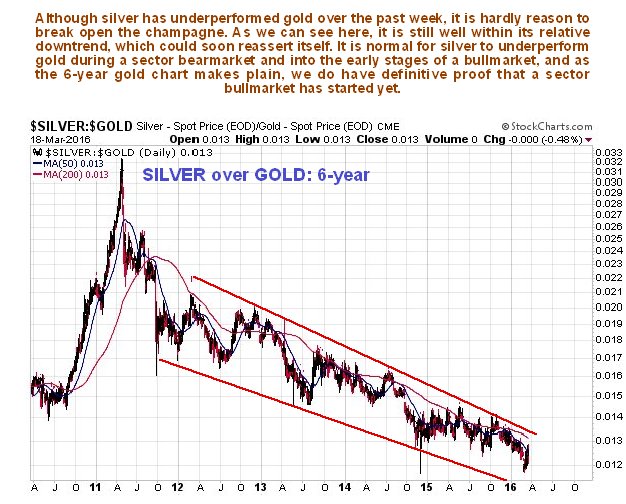
The 6-year chart for silver relative to gold shows that, even though silver had a flurry of outperformance last week, it is still well within its relative downtrend, which looks set to reassert itself shortly, increasing the chances of a silver reacting back quite hard.
Conclusion: although bugs are getting worked up and excited about its advance last week and attempt to break above $16, silver looks done here and set to slump back across its long-term downtrend channel.
