There is an extremely interesting development brewing in the silver market. Chances are high this will turn out bullish, although one should not exclude a bearish outcome.
Silver (and gold) forecasts in 2014 have been rather unanimously bearish or neutral, with only a minor number of analysts being positive. Longer term, we could expect better returns for the metals, for instance by analyzing the long term silver cycle reaching new highs in 2016.
On the near term, two important indicators are flashing a potential key reversal, at least for the short and mid term. First, sentiment is at an important pivot point. Second, the long term silver chart seems to be accomplishing (“resolving”) a multi year chart pattern. Let’s review both in this article.
Silver sentiment
This is an excerpt from last week’s Sentimentrader’s analysis:
Pessimism in a bear market has to reach a whole other level than pessimism in a bull market in order to consistently generate positive returns going forward. Since silver has been mired in a bear market for at least a year, we’ve been looking for true historic extremes in pessimism. It’s getting there.
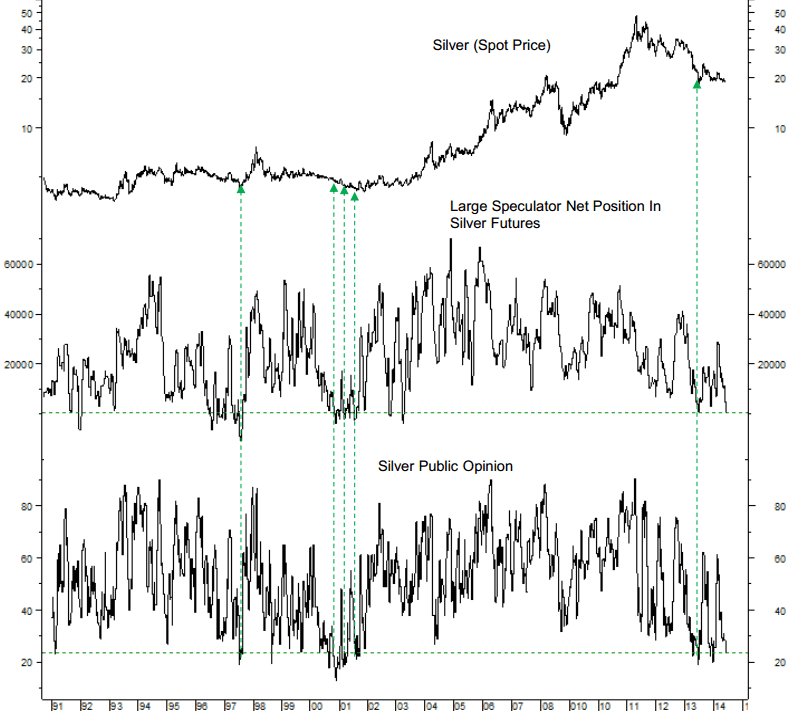
The latest data show that large speculators are net short silver futures to the greatest degree in a decade. At the same time, Public Opinion has dropped below 25%, one of the lowest readings since 1990.
The green highlights on the chart show the other times that both indicators were as extreme as they are now at the same time. All three led to at least a short-term bump in silver, but only the occurrence in 1997 led to a lasting rally of at least several months. In 2000, silver just kept dripping lower until finally the selling pressure abated and it ignited the massive bull market. In June 2013, the extremes saw silver climb more than 25% over the next couple of months, but obviously that rally failed.
It’s time to pay attention and start looking for reversal patterns in price.
Silver sentiment in June 2014 at an important pivot point
Chart pattern
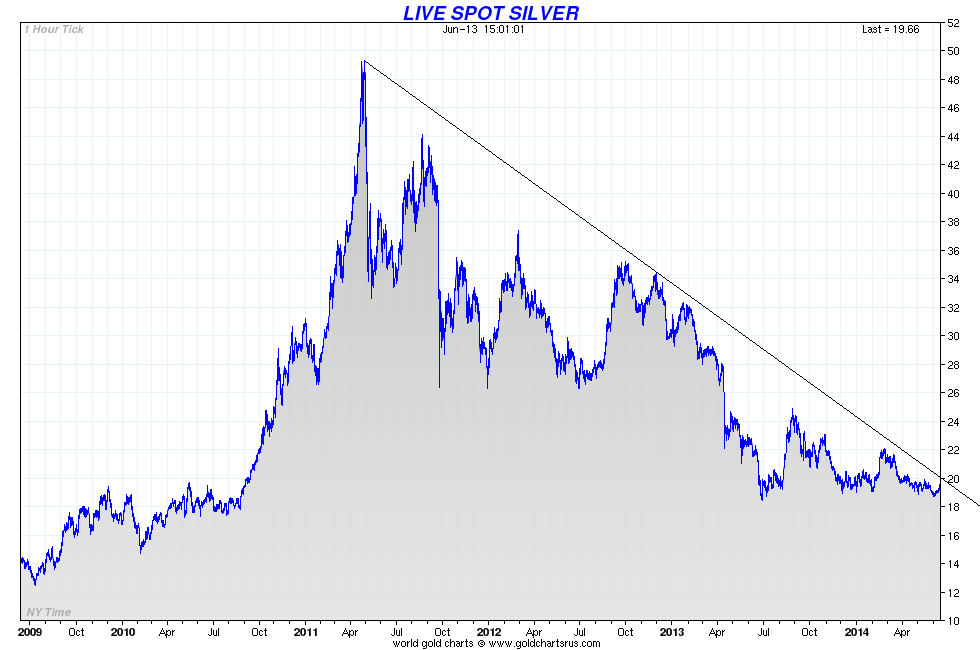
From a chart point of view, it seems clear that silver is ready to start trending. It is impossible to predict in which direction. Given the above and the multiyear chart formation which has set a solid base going back to 2009, it is very likely that the trend will be up. Very close attention should be paid at price action in the coming days and weeks, as nobody can exclude a bearish outcome. The key area to watch is $20 per ounce silver. If that level were to give away, then we are about to experience fireworks in the metals. Chart courtesy: sharelynx.com.

Silver price chart from 2009 till June 2014
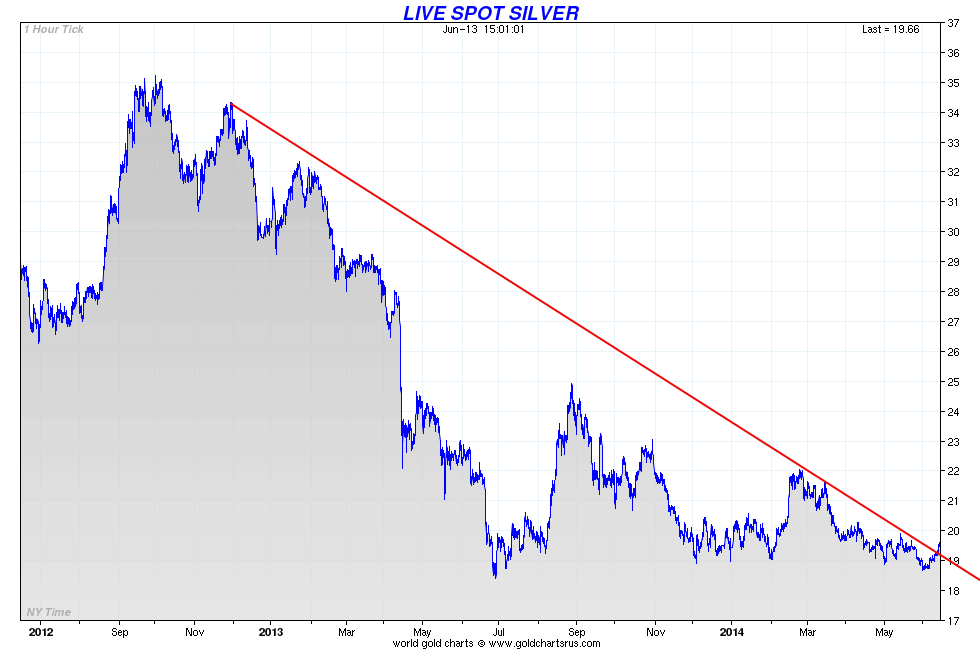
Silver price chart from 2012 till June 2014
A five year chart formation carries a lot of power. On the shorter timeframe (second chart) there is a first sign of a breakout, or, at least, a serious attempt. The same chart reveals that $19.50 is the key price level. It is safe to consider $20 as the key breakout area. Once breached, it is important to note that the silver price should stay there for at least 3 days and, in case it would retest $20, that it stays above it.

