Summary
- The Fed’s tapering exit strategy has created uncertainty globally.
- The U.S. Stock market is due for a major correction.
- Silver is making a cyclical bottom.
The current Fed’s monetary policies and exit strategy from its debt monetization have created a high level of uncertainty globally. The Fed is trying to assure us that the transition will be a smooth one. But the global markets are telling us another story and are reaching a different conclusion.
Even though the U.S. stock markets are not taking into account the catastrophic consequences of such policies, emerging markets and interest rates are reaching a completely different conclusion. They are giving investors a clearer indication regarding the negative implications from ending QE.
If the U.S. economy were as healthy as some pundits would like us to believe, then why are markets like Brazil's Bovespa and China’s Shanghai down 12% since Bernanke first announced the tapering of asset purchases by the Fed? Emerging markets such as Turkey have plummeted 34%, while the Turkish lira is down 20%. Copper, one of the most important economic indicators, is down 11% as the Fed continues to support the misconception that we have increasing economic growth in the U.S.
According to Michael Pento, Pento Portfolio Strategies:
In the U.S., nominal debt levels are increasing substantially. Meanwhile, the Fed’s purchases of Treasuries is headed towards 0%, from nearly 100% of all new debt issuance. In addition, the Fed is assuring markets that an inflation target of 2% and a real GDP growth level of 3% is going to be achieved in the near future. But the Ten-Year Note is currently yielding just 2.6%, and that yield is also falling. It is inconceivable to believe nominal GDP is going to be near 5%, while the Ten-Year Note is just half that level. This is even more incredulous given the historically-high deficits, which the Fed is supposedly ceasing to monetize. The simple truth is the Fed’s taper of asset purchases is going to lead to a collapse of stock and real estate values in the United States. And this will cause major turmoil in currencies, equities and interest rates across the globe.
In a recent interview for the Equity Management Academy, Dr. Marc Faber addressed the following question: “How can a major correction in the U.S. stock market affect the rest of the world markets?”
Well I’m not saying that every market trades around the S&P. But most markets are quite closely correlated to the S&P. If the S&P closes up 15 points, it is likely that in Asia and most markets will be up tomorrow. And if the S&P closes down 15 points, it is likely that most Asian markets will be down tomorrow. Similarly, the European markets will kind of follow the S&P. So the impact of the US economy on the global financial market is very large both in terms of interest rates and in terms of equity price movement.
Additionally we asked him:
Do you see a significant correction in US stocks on the horizon or just a minor correction in a long-term bull market?
Dr. Faber replied:
Well I been arguing now for almost a year that we might have a 20 percent correction in the market but I always explain, it is also possible that we are in a market like in 1986/87 when the market just kept on going up and up and eventually we have a huge 40 percent crash within two months.
With the general sentiment that stocks are vulnerable to a major correction, we asked Dr. Faber if he prefers to own gold or silver at this time, and he said:
I prefer to own physical gold and to store it outside the United States. It is an important issue to consider – where do I store my gold. And because I’m on the board of some gold and silver mining companies, resource companies including Sprott Inc., I own shares in mining related equities and also in mining companies such as Ivanhoe Mines (OTCPK:IVPAF) and NovaGold (NG), Sunshine Mining. So I have an exposure to both. If you ask my personal preference, I prefer to own physical gold, because I think that the entire financial system is going to implode at some point in the future.
SILVER
The silver market reached a high of 22.21 on February 3, 2014 and thus completed the short to intermediate cyclical bottom pattern expected since December 30, 2013 when the low of 18.80 was made.
In my last report, I made the following comments:
Our Live trading room subscribers exited all long positions short – term to intermediate above 22.10 for May silver. They were well informed and prepared days ahead of silver moving towards these expected levels of resistance and realized some very substantial profits.
The weekly high was 22.18. I also commented:
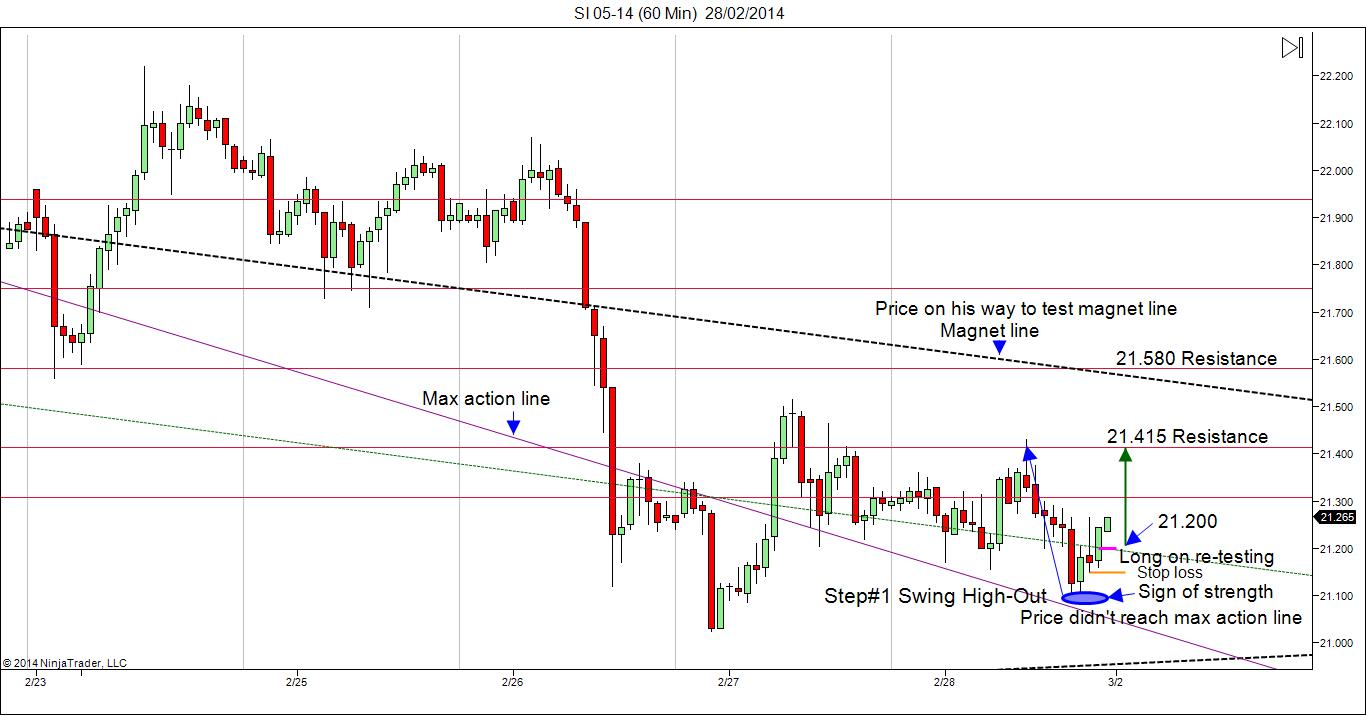
As mentioned above, the low 21.11 made on Thursday February 27, fulfilled the initial downside expectations for this correction and triggered a buy signal at 21.20 for the May Futures Contract.
With the high of 21.74 made last week, we were able to liquidate this trade at the 21.58 resistance level and magenta line shown in the chart above. This was a 38 cent gain or a $1,900 profit per full size (5000 ounces) silver futures contract.
On this report The VC weekly Price momentum Indicator also recommended:
Cover short on corrections at the 20.78 and 20.30 levels and go long on a weekly reversal stop. If long, use the 20.30 level as a Stop Close Only and Good Till Cancelled order. Look to take some profits on longs, as we reach the 21.98 and 22.70 levels during the week.
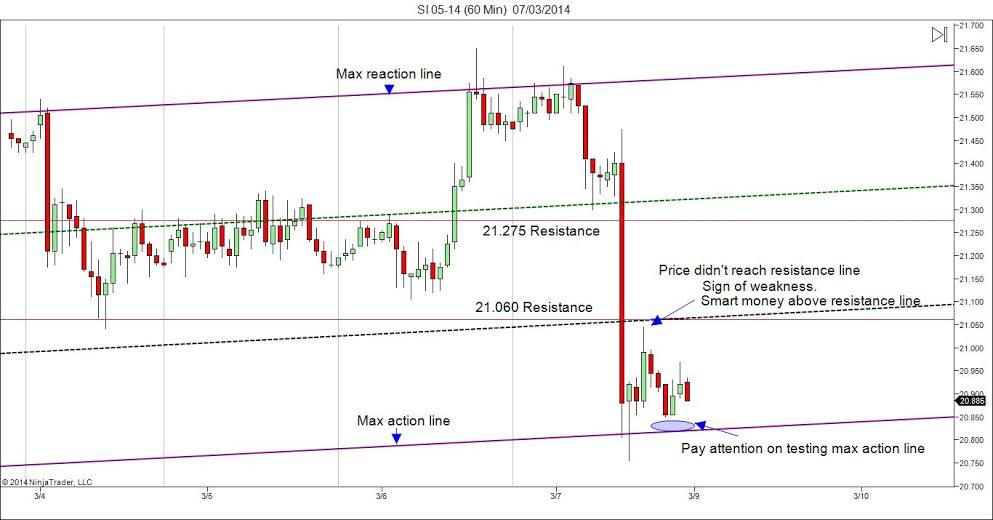
With the low of 20.75 made last week, it triggered another Buy Signal at the initial weekly support level of 20.78 and recommends to add another long if 20.50 is reached. If filled on the initial price of 20.78, use last week’s low of 20.75 as a weekly protective stop. If stopped out, look to re-enter the long side in the 20.50 to 20 area for next week. If this level is breached, a quick dip to 19.67 would offer long-term investors with another historic window of opportunity to add to their physical position in gold and silver bullion.
Let’s take a look at the weekly gold technical picture and see what trading opportunities we can identify for next week.
GOLD
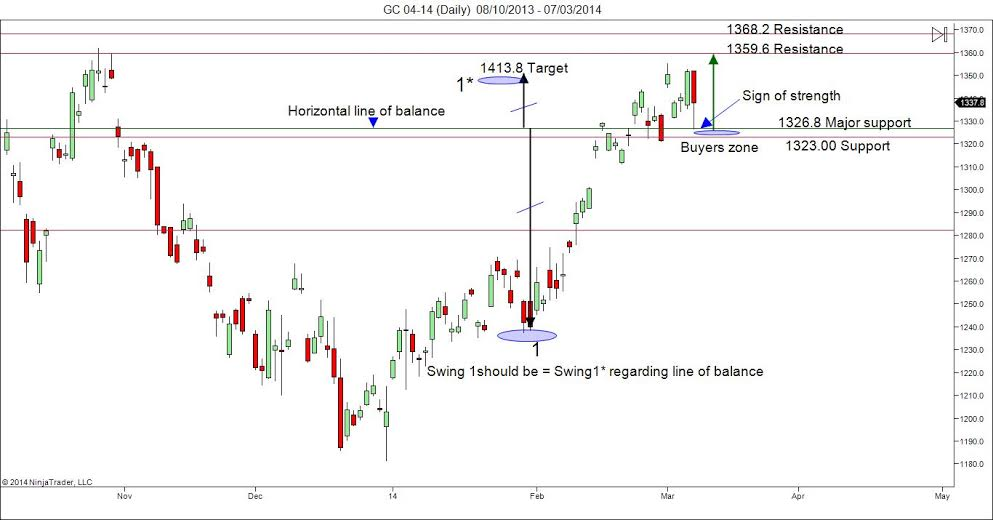
The April gold futures contract closed at 1340. The market closing above the 9 MA (1288) is confirmation that the trend momentum is bullish. A close below the 9 MA would negate the weekly bullish short-term trend to neutral.
With the market closing at the The VC Weekly Price Momentum Indicator of 1340, it confirms that the price momentum is neutral. A close below the VC Weekly of 1340 would activate a short signal. A close above the VC Weekly of 1340 would activate a long signal.
Cover shorts on corrections at the 1326 and 1311 levels and go long on a weekly reversal stop. If long, use the 1311 level as a Stop Close Only and Good Till Cancelled order. Look to take some profits on longs, as we reach the 1355 and 1369 levels during the week.
Disclosure: The information in the Market Commentaries was obtained from sources believed to be reliable, but we do not guarantee its accuracy. Neither the information nor any opinion expressed therein constitutes a solicitation of the purchase or sale of any futures or options contracts.
TRADING DERIVATIVES, FINANCIAL INSTRUMENTS AND PRECIOUS METALS INVOLVES SIGNIFICANT RISK OF LOSS AND IS NOT SUITABLE FOR EVERYONE. PAST PERFORMANCE IS NOT NECESSARILY INDICATIVE OF FUTURE RESULTS.


