- In a sign of speculative activity, retail investors are chasing higher beta stocks on the Nasdaq exchange. Total volume on the Nasdaq has been triple that of the NYSE lately. Previous similarities occurred in May 2011, November 2011 and February 2012. The first two signalled an intermediate top, while the rally continued for another month in the last occurrence.
- Volatility Index (VIX) has closed below 14 yesterday. This is the second lowest price period since the Global Financial Crisis started in late 2007. Previous closes below 15 since the GFC occurred in middle of April 2011 and in early March 2012. S&P peaked two weeks after and lost 16% & 10% respectively into the intermediate lows of August 2011 and June 2012.
- Favourite investment for fund managers today is to hide in the defensive stocks, large caps and strong brand names that pay higher a dividend yield relative to Treasuries. Prime candidate is S&P 100, which has bulls celebrating with an upside break out and a new bull market high this week. However, alarmingly low breadth is not confirming the break out, in my opinion.
- European stocks have now gained for 10 weeks straight. I am very uncomfortable with that type of a streak for any asset class, let alone one like European stocks where the fundamental situation seems to be worsening. Gains are attributed to oversold stock prices, negative sentiment and most importantly "hope" that central bankers including ECB's Mr Draghi will deliver more stimulus.
- Gold and Silver have been in a tight trading range since May of this year. Furthermore, this trading range continues to narrow even further with Bollinger Bands seriously compressing to at least a 12 month low. A major resolution should be close at hand and interestingly some miners seem to be leading the break on the upside, with Silver Wheaton moving 11% this week alone.
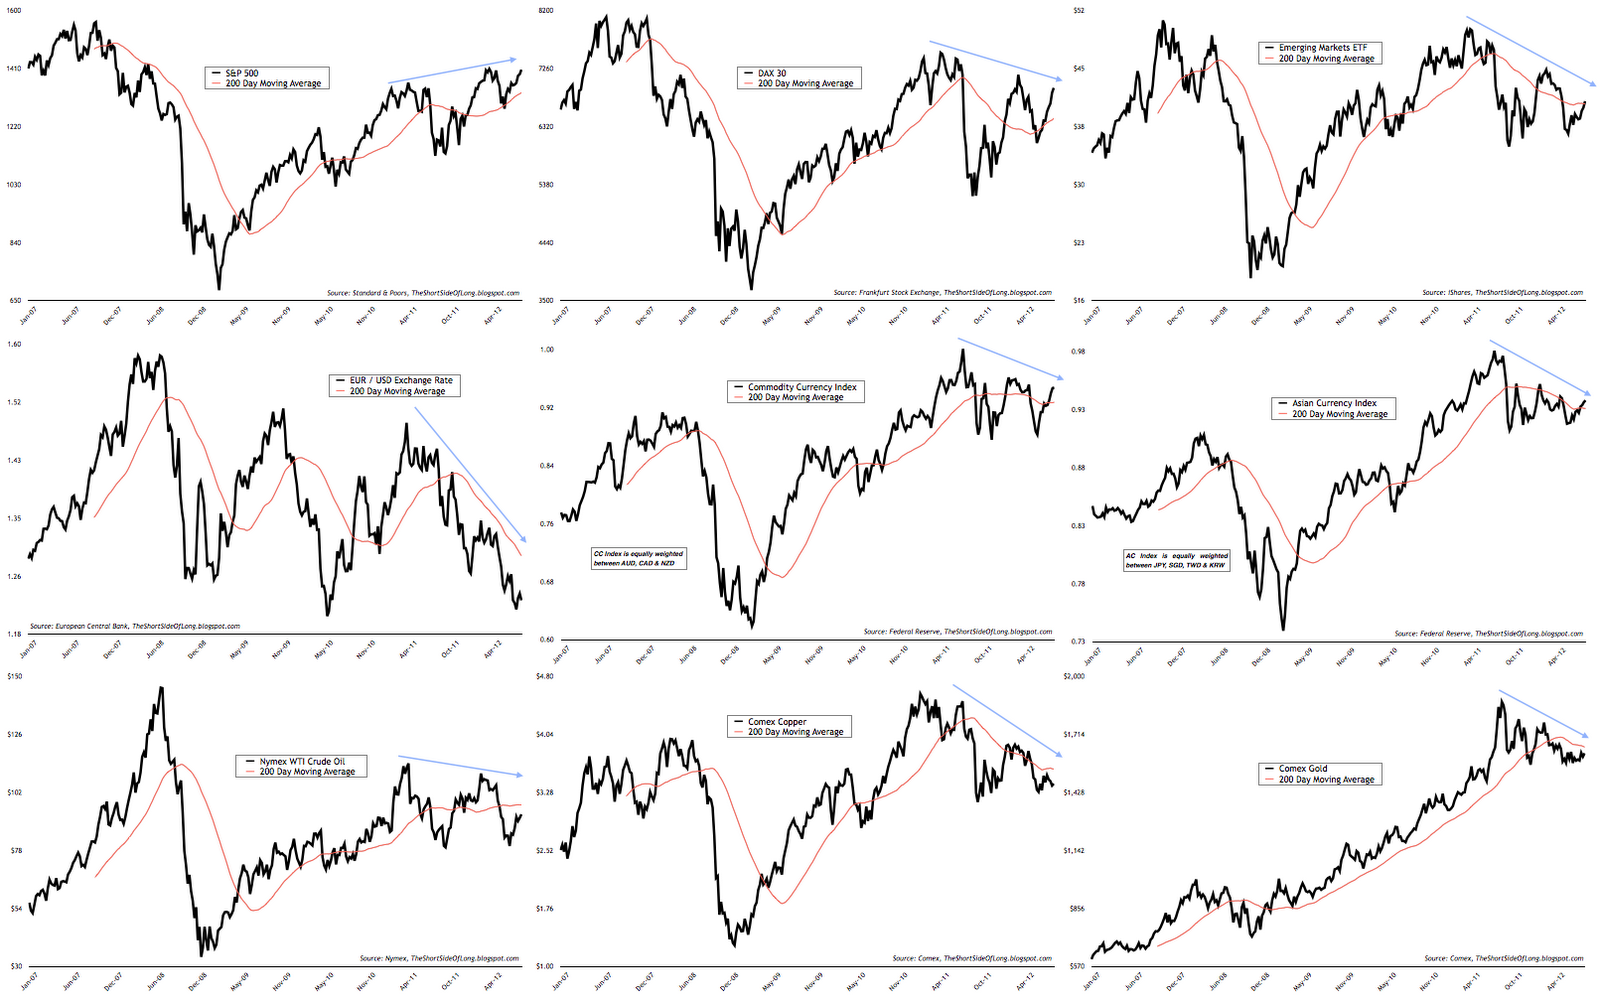
Short-term, we can see that copper and gold has failed to rally with other risk assets like Equities, Currencies and Crude Oil over last several weeks. Furthermore, the short term rise in the DAX 30, Commodity Currencies and Brent Crude (not shown here) has been almost vertical. So far no major commodity has regained the 200 day MA.
Leading Indicators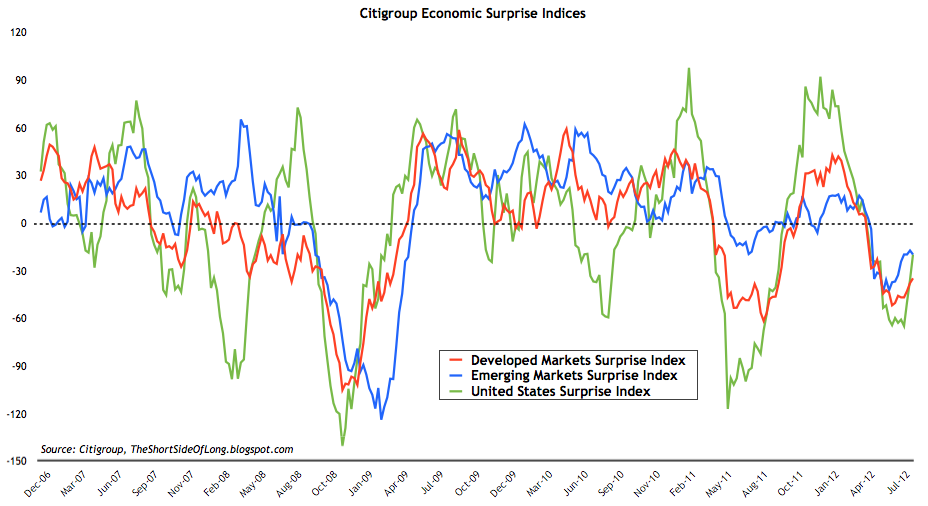
Global economic data continues to beat economist's expectations. This is a positive for the time being and it has been helping global stocks and other risk assets move higher in the last couple of weeks.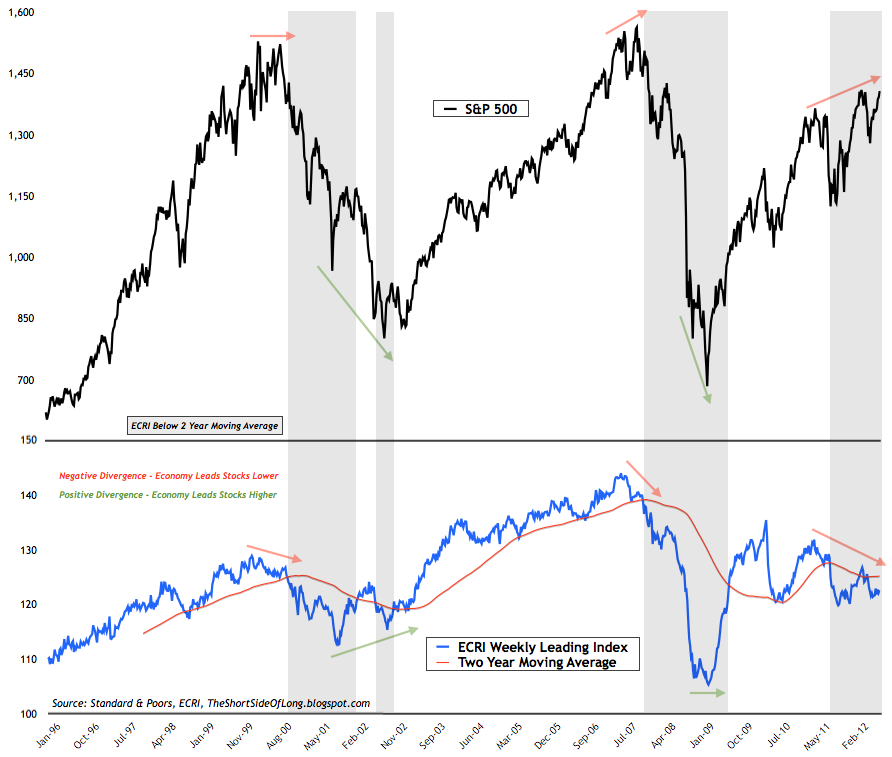
Despite data improvements relative to economists expectations and despite the rise in the stock market, ECRI WLI refuses to move higher and remains in a downtrend of lower highs. It seems that each rise in the stock market, produced by central bank stimulus, has created smaller and smaller boosts to real economic activity.
New OECD Leading Economic Indicator data shows Eurozone and China remain in a serious slowdown with economic contraction, while the US is now slowing and fading from positive growth. Japan is following the US into a slowdown too, while other BRIC countries are also losing momentum, with Russia recently entering negative growth on the LEI as well. In summary, OECD Total LEI's uptick in growth from the 2011 slowdown, is now rapidly fading.
Featured Article
Majority of market participants are discussing weather or not central banks are about to engage into re-inflating policies, which the world has witnessed several times since the 2008 recession and which Pavlov's dogs have become accustomed to at any sign of economic slowdown. While it is my opinion that various QE's from global central banks will occur eventually, the current "hopes" for further stimulus are not justified. Various data points, which Ben Bernanke himself follows closely, reveal that the time for additional easing is still NOT upon us.
You must be reading the beginning of this article and pretty much thinking that I am full of "you know what," since you have heard the rumours that Federal Reserve will most likely start a QE3 come Jackson's Hole. After all Mr Bernanke and other FOMC members have made promises over the last several months for further easing. Well, regardless of weather I am wrong or right, I personally think there is close to a 0% chance of QE3 right now. Let me explain: 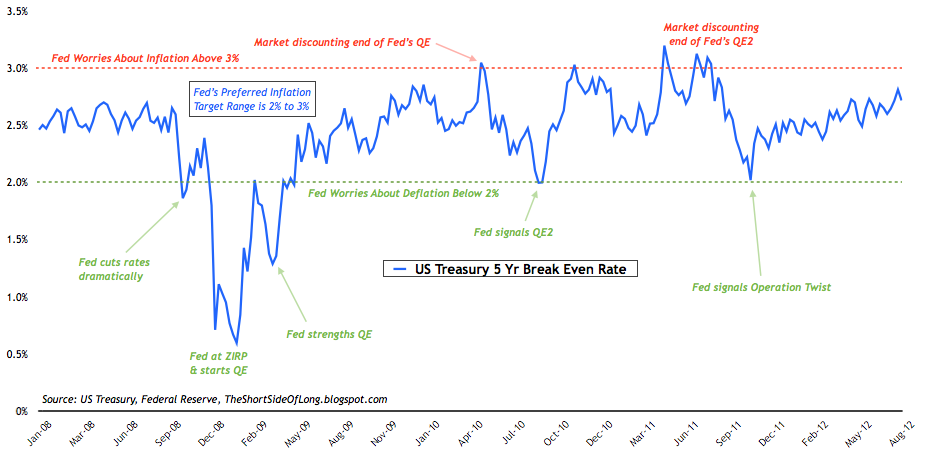
The chart above shows US Treasury 5 Year Break Even Rate, also known as market's forward inflation expectations over a 5 year maturity. The Fed closely follows these readings and prefers / tries to keep the expected inflation range between its mandate target of 2% on the downside and 3% on the upside. At various times, if the inflation expectations move out of the preferred target band, the Fed tends to intervene.
It tightens monetary policy if inflation expectations exceeds 3% (by letting various monetary programs conclude); and it eases monetary policy if inflation expectations falls below 2% (starts monetary programs as it worries about deflation shocks). In the chart above, we can see various interventions by the FOMC have been guided by the above indicator.
Assuming I am right and inflation expectations are way to high for the Fed to stimulate right now, the question is what would happen to major assets globally? Good question, let us compare the 5 Year Break Evens against S&P 500: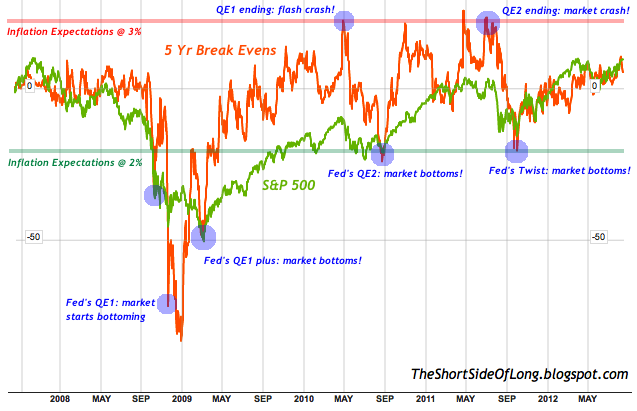
As we can see, the correlation between these two indicators is extremely positive. Historically, every Fed stimulus program came about due to a deflation shock, where the market's expectations of future inflation rate dropped below the Fed's target range. Historically the story runs like this:
- The market crashed into October 2008, the VIX capitulated above 80 and every single man and his dog were fearful that the world was well and truly ending. FOMC started the QE 1 during that infamous deflation shock of 2008. Equities started their bottoming process, however, it became obvious that inflation expectations still remained well below 2% target range. The Fed upped the ante on QE and the market bottomed almost instantly. A super rally followed.
- Recovery lasted well into spring of 2010, when the "inflation trade" became consensus. Majority of market participants started talking about how Federal Reserve was going to start its hiking cycle and the 5 Year Break Even hit the upper range of Fed's target. What followed was a market flash crash that was blamed on a trader's fat finger mistake ("highly likely story"), falling Core inflation figures and slowing economic activity.
- 5 Year Break Evens found themselves edging onto the Fed's 2% target during summer months, which is the lower bound of the range. It was time to act. At the Jackson's Hole meeting in late August 2010, Federal Reserve Chairman Ben "Helicopter" Bernanke announced that he was going to begin another round of QE. The market bottomed almost instantly and another super rally followed well into the early parts of 2011.
- The inflation outlook was running well and truly wild at this point. Emerging markets were overheating and commodities were going through the roof. It was once again time for the Federal Reserve to end all of its programs and think about how to start tightening monetary policy. Break Evens were again around the 3% upper bound range and the S&P 500 as well as majority of all other risk assets started peaking (majority of which are still below this high).
- All of a sudden in late July, US budget problems started to appear on front page as we watched politicians play a game of chicken, refusing to raise the debt ceiling. Eventually in early August, S&P downgraded the US and risk assets crashed. The sell-off was blamed on the US losing its AAA rating, but we all know that Bonds rallied and Stocks/Commodities fell because QE2 finished, which meant the Federal Reserve was tightening their expansive policy and closing the stimulus taps.
- Only a couple of months pasted and the Break Even rate found itself on the lower range of the Fed's 2% target. The deflation trade became consensus again, just like during the summer months of 2010. Recession talk was spreading like wildfire. It was time to act. Out of nowhere, FOMC held a "panic" meeting and the Federal Reserve Chairman Ben "Helicopter" Bernanke announced that he was going to stimulate again, starting a program called Operation Twist. The market bottomed almost instantly and another strong rally followed.
So here we are today with 5 Year Break Even rate around 2.7%, well away from Fed's lower bound of 2%, and yet Pavlov's dogs are fuelling the current risk rally on a "hope" that further money printing is just around the corner. The reason I say "hope" is because it takes a blind man not to recognise that economic activity is slowing rapidly, the business cycle is contracting and the global economy is approaching a recession. At the same time, S&P 500 is less than 1% below its bull market high.
Unless Bernanke is willing to risk the Federal Reserve's reputation and go against his mandate, one could easily assume that "hopes" of further stimulus coming out of the FOMC meetings or Jackson's Hole are just that... hopes. For the Fed to restart its "money printing" programs, we would need to see Break Evens fall towards 2%. In other words we would need to see another deflation shock within the financial markets and if correlations are anything to go by, that would mean a strong sell off in the S&P 500 and Crude Oil, a serious spike in the VIX and a rally in the US Dollar and Treasury Bonds. It is only then that we could see Federal Reserve and "Helicopter Ben" act again...
Trading Diary
- Outlook: I am of the opinion that the risk asset bear market is upon us and that the global economy continues to slow rapidly into a recession. US GDP has grown 5 out of the last 6 quarters below 2%, which tends to be stall speed. Over the last 60 years, whenever stat like that occurred, we always entered a recession. At the same time corporate earnings and gross profit margins are at record highs, so I expect a mean reversion unlike so many stock analysts. Cash levels with mutual funds, retail investors and money market funds are at extreme lows, financial stress is starting to rise, volatility is at very complacent levels and credit spreads are very narrow relative to fundamentals, so I expect a risk off scenario in due time.
- Positioning: Long focus is towards secular commodity bull market, with Precious Metals and Agriculture offering the best value. Substantial position is held especially in Silver, because I believe central banks will eventually print money again, as the global economic activity deteriorates. Precious Metals longs are hedged because Silver could break down below $26 support, but on upside break hedges will be taken off. Short focus is towards secular equity bear market, with cyclical sectors and credit offering best selling opportunities. Mild to modest exposure is held short in the Junk Bond market, as well as various US stock sectors like Technology, Discretionary and Dow Transportation.
- Watch-list: Commodity currencies like aussie, kiwi and loonie are also on my watch list of potential shorts right now, as negative surprises await with China slowing dangerously. With the euro being the most hated currency, a better risk off trade could be selling the British pound right now. A major short in due time will be US Treasury long bonds, as they are extremely overbought and in a mist of a huge bubble mania, but first we have to wait for the eurozone dust to settle.
