If last week’s market action is any indication, the proverbial “sell in May and stay away” axiom may be ahead of schedule this year…
Equities had to deal with a disappointing jobs report, an underwhelming bond auction in Spain, a handful of disappointing key earnings reports, and less-than-encouraging consumer confidence data.
For the week, the S&P 500 dropped 2%, the Nasdaq composite was down 2.2%, and the Russell 2000 small-cap index was down 2.5%. Even mighty Apple Corp. (AAPL) posted poor weekly performance, challenging a bullish trendline that has been in place since the stock went vertical at the beginning of 2012.
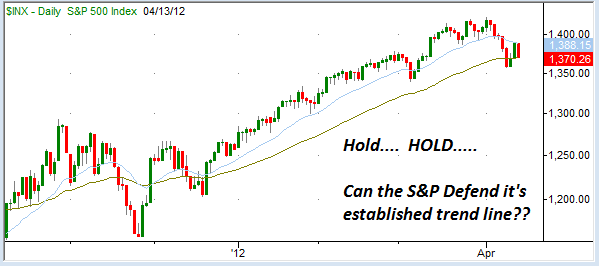
Selling pressure has knocked the bulls back on their heels, with the major indices (S&P 500, Dow, Nasdaq Composite etc.) threatening to break below the key 50 day Exponential Moving Average – a key variable for many mechanical trading systems…
The broad averages are hitting critical technical levels at the same time that we enter the heart of earnings season. Analysts and media outlets have already begun to characterize this earnings season as “disappointing”, paving the way for a significant sentiment shift over the next few weeks.
Does this mean a sharp trade lower is guaranteed? Of course not…
Barron’s had an interesting weekend article titled “Why the Smart Money Looks Dumb” which outlined how institutional managers have been under-exposed to the first quarter rally – and may very well use a pullback to allocate capital back into risky equities…
A key fact of the 2012 stock market is that many sophisticated investors—the supposed “smart money”—have missed the rally, which has boosted some stocks by more than 50%. Because the eyes of the sophisticates are fixated on Europe’s economic problems, and their minds are searching for data to dispel evidence of a U.S. recovery, many of the funds and accounts they run are trailing their performance benchmarks. This most likely exacerbates some of the recent intraday volatility.
WHEN THE STOCK MARKET DECLINES in reaction to some data, the smart money trades futures contracts to pressure share prices. This crowd uses news and market commentary to paint a menacing picture worthy of Stephen King. Yet, at some point, even those nattering nabobs of negativity fill the bullish void in the options and stock market with buy orders. That helps stocks bounce higher.
What makes the smart-money put so powerful is that fund managers face real problems if they lag behind the performance of the stock market or their peers. The need to at least match—and ideally beat—performance benchmarks almost forces them to buy stocks. If they don’t deliver good returns, they may find that their investors flee into the arms of better-performing managers.
Performance anxiety can certainly provide underlying support during “normal” corrections. But following a sustained mult-month rally with plenty of opportunities for the “smart money” to get involved, the rollover pattern looks much more ominous.
In the Mercenary Live Feed, we are methodically adding to our bearish exposure, while carefully tightening risk points on bullish trades that are holding up well – and cutting out the bullish positions that aren’t.
Below, a few of the areas we are particularly interested in this week…
Financials Fall on Disappointing Earnings
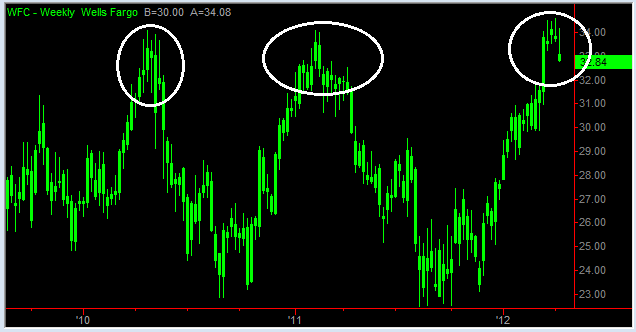
Wells Fargo (WFC) and JPMorgan Chase (JPM) dropped a bomb on the financial sector Friday after announcing first quarter earnings.
The major media outlets reported that the earnings figures were above expectations. But the devil was in the details, and a closer look at the data showed that the earnings beat was largely a result of setting aside less in reserves for future losses.
Financial stocks (specifically, blue-chip banks) have been a significant supporting factor for the broad market, and without their influence, it will be much more challenging for equities overall.
This week, we have announcements from Bank of America (BAC), Capital One Financial (COF), Morgan Stanley (MS), as well as American Express (AXP). If the group follows the disappointment trend set by WFC and JPM last week, the market tone could become quite ominous – quite quickly…
On a weekly chart, the major banks like WFC, JPM and BAC have significant overhead resistance issues. A reversal at current levels would set up some very attractive short patterns – with plenty of room to run before hitting late 2011 support areas. 
Small-Caps: Canary In the Coal Mine
If the large-cap indices are setting up questionable patterns, small-cap stocks are confirming the danger.
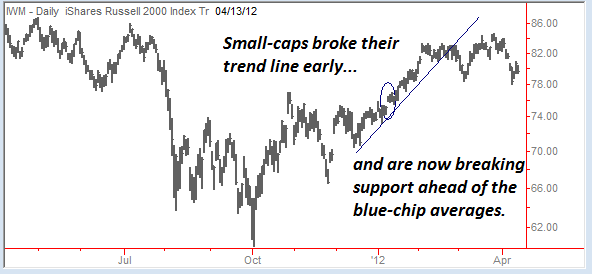
While blue-chips have been steadily rising during the entire first quarter, the Russell 2000 Index (IWM) broke its trend line mid-way through February. It’s important to note that while most US indices were breaking to new 3-year highs, IWM languished well below the 2011 highs.
Last week, the action saw IWM breaking through short-term support levels as managers once again embraced a “risk-off” mentality and dumped allocations to speculative positions.
The break of support followed by a three day “drift” higher, sets up an attractive entry point for us this week. We can set up a conditional short position which will be triggered when the ETF breaks the 2-day low, with a risk point just above the high from last week.
There are actually a number of viable securities for us to use here. The Small Cap Bull 3X Shares (TNA) may end up being a better short candidate as the volatility decay from this leveraged inverse ETF would actually work in our favor. All trades are time stamped and reported in real-time via the Mercenary Live Feed. You can sign up for a 14-day free trial to see how we are positioned heading into what looks like another challenging period for the bulls.
Doctor Copper Gives Poor Diagnosis
There’s a reason why copper is considered the metal “with a PhD in Economics.” As global growth is called into question – China just reported its fifth straight quarter of decelerating growth – demand for this important industrial metal wanes.
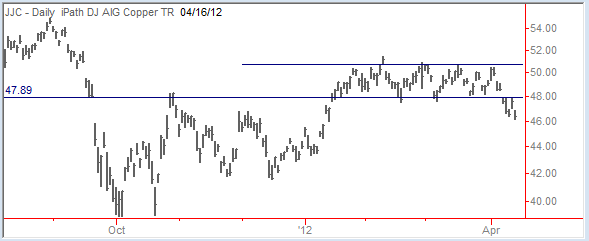
During the first quarter when the broad averages were trending higher, copper hardly participated. The metal sat in a tight range from mid-January through the end of March – well below its 2011 highs.
Last week, copper broke below the support area and now appears set to test the late 2011 lows. Our trend following expert, Nathan O., likes the pattern and is partial to new trends that emerge out of tight range-bound setups.
We’re watching the action carefully and the iPath DJ AIG Copper (JJC) – an ETF tracking the commodity price – may very well be our next position in the Global Trend Capture service. 
Heading into the open, the futures are indicating a relief bounce after last week’s breakdown. This isn’t unexpected, and will give us a chance to determine whether the bulls really have what it takes, or if they are quickly overwhelmed (leading to a reversal day).
Choppy action isn’t a new phenomenon for us. We’ve dealt with unpredictable swings for the better part of the last two years. Continue to exercise proper risk management and position sizing as we jockey for position and carefully determine where we want to allocate our trading capital.
Disclosure: This content is general info only, not to be taken as investment advice. Click here for disclaimer
- English (UK)
- English (India)
- English (Canada)
- English (Australia)
- English (South Africa)
- English (Philippines)
- English (Nigeria)
- Deutsch
- Español (España)
- Español (México)
- Français
- Italiano
- Nederlands
- Português (Portugal)
- Polski
- Português (Brasil)
- Русский
- Türkçe
- العربية
- Ελληνικά
- Svenska
- Suomi
- עברית
- 日本語
- 한국어
- 简体中文
- 繁體中文
- Bahasa Indonesia
- Bahasa Melayu
- ไทย
- Tiếng Việt
- हिंदी
Sell In… April??
Published 04/16/2012, 09:39 AM
Updated 07/09/2023, 06:31 AM
Sell In… April??
Latest comments
Loading next article…
Install Our App
Risk Disclosure: Trading in financial instruments and/or cryptocurrencies involves high risks including the risk of losing some, or all, of your investment amount, and may not be suitable for all investors. Prices of cryptocurrencies are extremely volatile and may be affected by external factors such as financial, regulatory or political events. Trading on margin increases the financial risks.
Before deciding to trade in financial instrument or cryptocurrencies you should be fully informed of the risks and costs associated with trading the financial markets, carefully consider your investment objectives, level of experience, and risk appetite, and seek professional advice where needed.
Fusion Media would like to remind you that the data contained in this website is not necessarily real-time nor accurate. The data and prices on the website are not necessarily provided by any market or exchange, but may be provided by market makers, and so prices may not be accurate and may differ from the actual price at any given market, meaning prices are indicative and not appropriate for trading purposes. Fusion Media and any provider of the data contained in this website will not accept liability for any loss or damage as a result of your trading, or your reliance on the information contained within this website.
It is prohibited to use, store, reproduce, display, modify, transmit or distribute the data contained in this website without the explicit prior written permission of Fusion Media and/or the data provider. All intellectual property rights are reserved by the providers and/or the exchange providing the data contained in this website.
Fusion Media may be compensated by the advertisers that appear on the website, based on your interaction with the advertisements or advertisers.
© 2007-2024 - Fusion Media Limited. All Rights Reserved.
