
Sealed Air Corporation (NYSE:SEE) reported second-quarter 2017 adjusted earnings per share of 35 cents, down 5.4% year over year. Earnings also missed the Zacks Consensus Estimate of 36 cents.
Including special items, the company posted earnings of 14 cents per share, compared with earnings of a cent recorded in the year-ago quarter.
Total revenue increased 3% year over year on a reported basis to $1.07 billion in the quarter. Revenues beat the Zacks Consensus Estimate of $1.064 billion. Currency had a negative impact on total net sales of 0.7% or $7 million. As reported, net sales North America increased 9%. However, Asia Pacific sales declined 2% while Latin America and EMEA declined 4% each.
Cost and Margins
Cost of sales went up 5.3% year over year to $726 million. Gross profit dipped 2% to $344.3 million. Gross margin contracted 150 basis points (bps) to 32.2% in the quarter.
SG&A expenses increased 2% to $201.8 million from the prior-year period. Adjusted earnings before interest, taxes and $196 million compared with $194 million in the prior-year quarter. Adjusted EBITDA margin was 18.3% compared with18.6% in the prior-year quarter.
Sealed Air Corporation Price, Consensus and EPS Surprise
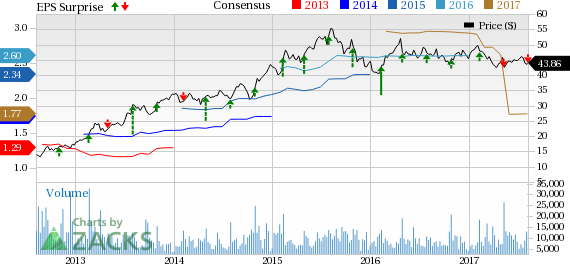
Sealed Air Corporation Price, Consensus and EPS Surprise | Sealed Air Corporation Quote
Segment Performance
Food Care: Net sales inched up 2.2% year over year to $680 million. Currency had a positive impact of 0.4% or $3 million. On a constant dollar basis, net sales increased 2.6% due to positive volume growth of 2.7%. Adjusted EBITDA remained flat at $146 million.
Product Care: The segment reported net sales of $391 million, up 4.4% year over year on a reported basis and 5.7% on a constant dollar basis. Currency had a negative impact on Product Care net sales of 1.3% or $5 million. Sales volume increased 6.1%. Adjusted EBITDA decreased 2% to $77 million.
Financial & Other Updates
Cash and cash equivalents were $243 million as of Jun 30, 2017, down from $333.7 million as of Dec 31, 2016. Cash flow from operating activities was $141 million during the first half of fiscal 2017, down from $186.9 million in the prior-year comparable period.
As of Jun 30, 2017, Sealed Air’s net debt came in at $4.203 billion, up from $3.809 billion as of Dec 31, 2016.
Till Aug 1, 2017, Sealed Air repurchased approximately 6.5 million shares for approximately $285 million. The company has approximately $1.9 billion available for repurchase under its share repurchase program.
In Mar 2017, Sealed Air had entered into a definitive agreement to sell Diversey to Bain Capital Private Equity, a leading global private investment firm, for $3.2 billion. The company stated that it is on track to close the sale in September. This is a step in its transformation and enables it to enhance strategic focus on the Food Care and Product Care divisions along with simplifying operating structure. The net proceeds from this transaction will be utilized to repay debt and maintain credit profile, repurchase shares to minimize earnings dilution, and fund core growth initiatives, including potential complementary acquisitions to Food Care and Product Care divisions.
Guidance
For full-year 2017, Sealed Air expects sales of $4.3 billion compared with $4.2 billion recorded in 2016. The guidance reflects an expected 3% constant dollar sales growth in Food Care and 3–4% constant dollar sales growth in Product Care. Currency is not expected to have a material impact on results. Adjusted EBITDA is estimated to lie within $825–$835 million. Adjusted EPS is likely to be in the range of $1.75–$1.80 for 2017.
Share Price Performance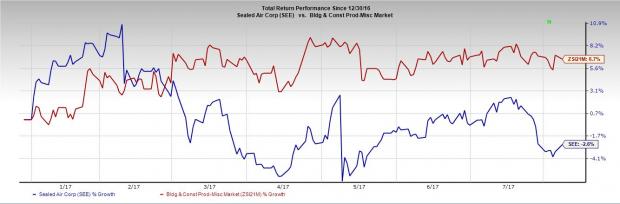
Year to date, Sealed Air has grossly underperformed the industry with respect to price performance. While the stock dipped 2.6%, the industry recorded growth of 6.7%.
Zacks Rank & Key Picks
Currently, Sealed Air carries a Zacks Rank #3 (Hold).
Some better-ranked stocks in the sector include Caterpillar Inc. (NYSE:CAT) , Terex Corporation (NYSE:TEX) and AGCO Corporation (NYSE:AGCO) . All three stocks flaunt a Zacks Rank #1 (Strong Buy). You can see the complete list of today’s Zacks #1 Rank stocks here.
Caterpillar has expected long-term growth rate of 9.50%.
Terex has expected long-term growth rate of 20.07%.
AGCO has expected long-term growth rate of 13.51%.
Looking for Stocks with Skyrocketing Upside?
Zacks has just released a Special Report on the booming investment opportunities of legal marijuana.
Ignited by new referendums and legislation, this industry is expected to blast from an already robust $6.7 billion to $20.2 billion in 2021. Early investors stand to make a killing, but you have to be ready to act and know just where to look. See the pot trades we're targeting>>
Sealed Air Corporation (SEE): Free Stock Analysis Report
Terex Corporation (TEX): Free Stock Analysis Report
Caterpillar, Inc. (CAT): Free Stock Analysis Report
AGCO Corporation (AGCO): Free Stock Analysis Report
Original post
Zacks Investment Research