Forex News and Events:
The divergence in monetary policy is now providing FX markets with much needed volatility and direction. Fed Chair Yellen's Jackson Hole address was less dovish than many had expected and provides a clear path toward the start of US tightening cycle (with the caveat of data dependency and cautions action). Overnight, St Louis Fed President James Bullard (non-voting member) stated that the Fed would have to change their wording of under-utilization of labor resources and forward guidance so as not to adjust rates for a considerable time. This very public discourse only highlights that this fall the market's focus will be on the Fed debates on reshaping guidance after QE3 ends in October. ECB president Draghi delivered the strongest indication that he was ready to halt the current entrenchment of Japanese style stagnation. He acknowledged that inflation prospects had weakened and previously stated that worsening conditions in medium term inflation outlook would provide a rationale for the ECB to conduct broad-based asset purchases or full blow quantitative easing. In addition, Draghi called for proactive policies demand & supply-side and advised European governments to extend fiscal organization. However, this is similar to what we heard last year, making it slightly less monumental than many had heralded. However, he did signal that additional monetary easing could occur as soon as September (we suspect this is a low probabilty event). While from Japan, BoJ Governor Kuroda sounded ultra-dovish indicating that more easing would occur if the data deemed it necessary.
The market seems to be pricing a rising probability that the ECB will take further action. A realization which had potentially offset concerns emulating for the Fed tightening cycle. Rally in European stocks helped push US equities higher (S&P 500 broke historic 2,000 level). EUR and euro area bond yields traded lower while USD and US treasury yields ticked higher. Recent US economic data showed softness in new home sales and slow pace of growth in service sector. Given Yellen's indication that policy action will be data dependent, traders will be examining reports vigilantly. However, baring a significant shift in economic prospect, we expect the Fed will begin tightening rates at the end of Q1. This is an outlook that will keep us constructive on the USD and bearish on EUR and JPY. Along these lines we are also constructive on Asia currency as monetary policy is relatively more supportive. Malaysia, Thailand and Philippines are countries that central banks have raised or halted easing cycle while having supportive external balances.

Today's Key Issues (time in GMT):
2014-08-26T07:30:00 SEK Jul PPI MoM, last -0.10%2014-08-26T07:30:00 SEK Jul PPI YoY, last 2.30%
2014-08-26T08:30:00 GBP Jul BBA Loans for House Purchase, exp 44065, last 43265
2014-08-26T12:30:00 USD Jul Durable Goods Orders, exp 8.00%, last 0.70%, rev 1.70%
2014-08-26T12:30:00 USD Jul Durables Ex Transportation, exp 0.50%, last 0.80%, rev 1.90%
2014-08-26T12:30:00 USD Jul Cap Goods Ship Nondef Ex Air, exp 0.70%, last -1.00%, rev -0.30%
2014-08-26T12:30:00 USD Jul Cap Goods Orders Nondef Ex Air, exp 0.20%, last 1.40%, rev 3.30%
2014-08-26T13:00:00 USD Jun FHFA House Price Index MoM, exp 0.30%, last 0.40%
2014-08-26T13:00:00 USD 2Q House Price Purchase Index QoQ, exp 3.15%, last 1.30%
2014-08-26T13:00:00 USD Jun S&P/CS 20 City MoM SA, exp 0.00%, last -0.31%
2014-08-26T13:00:00 USD Jun S&P/CS Composite-20 YoY, exp 8.30%, last 9.34%
2014-08-26T13:00:00 USD Jun S&P/CaseShiller Home Price Index NSA, exp 172.84, last 170.64
2014-08-26T13:00:00 USD 2Q S&P/Case-Shiller US HPI NSA, last 150.76
2014-08-26T13:00:00 USD 2Q S&P/Case-Shiller US HPI YoY, last 10.35%
2014-08-26T14:00:00 USD Aug Consumer Confidence Index, exp 89, last 90.9
2014-08-26T14:00:00 USD Aug Richmond Fed Manufact. Index, exp 6, last 7
The Risk Today:
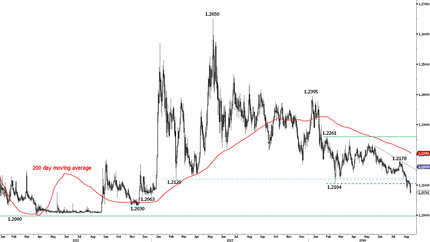
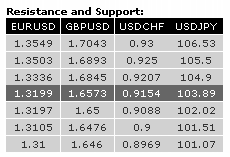
EURUSD EUR/USD is trying to stabilise after its recent new lows. However, the short-term technical structure is negative as long as prices remain below the hourly resistance at 1.3297 (22/08/2014 high). An initial resistance stands at 1.3242 (21/08/2014 low). An hourly support now stands at 1.3179 (intraday low). In the longer term, EUR/USD is in a succession of lower highs and lower lows since May 2014. A long-term decline towards the strong support area between 1.2755 (09/07/2013 low) and 1.2662 (13/11/2012 low) is favoured. However, in the shorter term, monitor the key support at 1.3105 (06/09/2013 low) given the general oversold conditions. A key resistance lies at 1.3444 (28/07/2014 high).
GBPUSD GBP/USD made an intraday bullish reversal (hammer) yesterday. Coupled with the key support at 1.6460 and the oversold conditions, a short-term rebound is likely. A break of the resistance at 1.6679 (see also the declining trendline) would confirm this scenario. An initial resistance lies at 1.6601 (21/08/2014 high). An hourly support can be found at 1.6501 (25/08/2014 low). In the longer term, the break of the key support at 1.6693 (29/05/2014 low, see also the 200 day moving average) invalidates the positive outlook caused by the previous 4-year highs. However, the lack of medium-term bearish reversal pattern and the short-term oversold conditions do not call for an outright bearish view. A key support stands at 1.6460 (24/03/2014 low).
USDJPY USD/JPY has failed to hold above the key resistance at 104.13, suggesting a potential false breakout. A break of the hourly support at 103.50 (22/08/2014 low) would confirm a deterioration of the short-term technical structure. Another support lies at 102.91 (intraday low, see also the rising trendline). A resistance can now be found at 104.49 (25/08/2014 high). A long-term bullish bias is favoured as long as the key support 100.76 (04/02/2014 low) holds. The break to the upside out of the consolidation phase between 100.76 (04/02/2014 low) and 103.02 favours a resumption of the underlying bullish trend. Strong resistances can be found at 105.44 (02/01/2014 high) and 110.66 (15/08/2008 high).
USDCHF USD/CAD has breached the resistance at 1.0986, but has thus far failed to make any follow-through. A short-term bullish bias is favoured as long as the hourly support at 1.0928 (22/08/2014 low) holds. Another support stands at 1.0861 (15/08/2014 low), whereas another key resistance can be found at 1.1053. In the longer term, the technical structure looks like a rounding bottom whose minimum upside potential is at 1.1725. However, a break of the support area implied by the long-term rising trendline and 1.0559 (29/11/2013 low) would invalidate this long-term bullish configuration.

