: 39%
VIX Status: 19%
General (Short-term) Trading Call: Hold.
Commentary
I have not written a T2108 Update in a little over a week. At that time, it seemed bulls were finally regain momentum. The S&P 500 was launching off critical support that kept the index within its breakout territory and following the 50DMA trend upward. Since then, the S&P 500 stalled, making little progress. On Tuesday, the stock market began the month with a strong rally that generated fresh multi-year highs for the Dow Jones Industrial and took the S&P 500 close its own multi-year highs. It has been all downhill since. The current selling seems to be flagging a topping pattern with this week delivering the first lower high of the 2012 rally.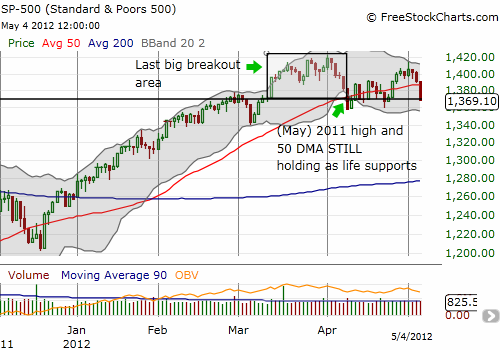
Traders must assume that the S&P 500 has now printed a lasting top. Such a top would be consistent with another scramble to sell in May (see my last “sell-in-May” analysis in “If You Must Sell In May, Choose The Start Or The End Of The Month“). Only fresh highs will break this latest bearish spell.
Note well that this pattern does not mean trading will become instantly easy for bears going forward. The market has now gone nowhere for two months, churning up and down, providing alternating periods of chills and thrills. This could very well continue for weeks more. T2108 now sits at a very neutral 39%, so it provides no directional guidance. I expected it to trip overbought this past week in time for selling in May, but T2108 only got as high as 60% on May 1. I now switch my forecast to expect oversold conditions before overbought conditions occur again. The bounce from oversold conditions could be relatively sharp and deliver some brief upward momentum as some bears get caught scrambling to close out short positions. However, my overall bias is now officially bearish. That is, I no longer expect a break to new 52-week (multi-year highs) anytime soon. While I have no downside target, I will be looking to fade rallies and aggressively trade against stocks retesting resistance levels or breaking critical support.
I have posted chart reviews on stocks that all look very vulnerable here: YELP (YELP), Baidu (BIDU), and Shutterfly (SFLY). There are many others. I closed out a put on Siemens (SI) on Friday. It made sense as fears of European recession constantly grow.
This is an example of a change in my thinking. Previously, I was looking for opportunities to buy into Europe’s malaise. I now think the odds favor the other side until at least the market delivers another crescendo of selling. The chart below shows how much Siemens is suffering as it breaks to prices last seen close to October’s lows. The rapidly declining 200DMA is likely to combine with the 50DMA to provide firm resistance for months to come. 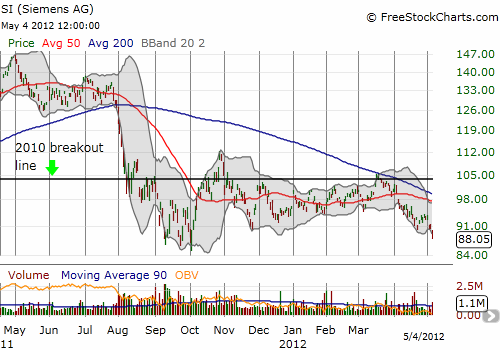
My Caterpillar (CAT) watch is also confirming bearish undertones. CAT failed to generate fresh excitement after its last earnings. It is now trading below $100 and seems certain to retest its 200DMA. I doubt this test will succeed as CAT seems destined to eventally give up all its gains for the year.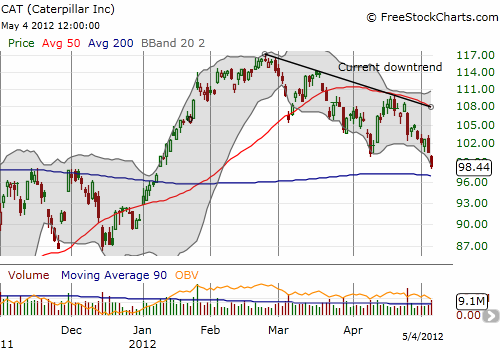
The volatility index, the VIX, may be the last piece of the puzzle. The VIX has been making a slow comeback since I last wrote the T2108 Update. The VIX has been stymied by resistance around 21 for most of this year. A break above that level will open the floodgates for bearish sentiment. This level was the flashpoint for a lot of the drama in 2011. It last broke to the upside in late July…and we know what happened after that!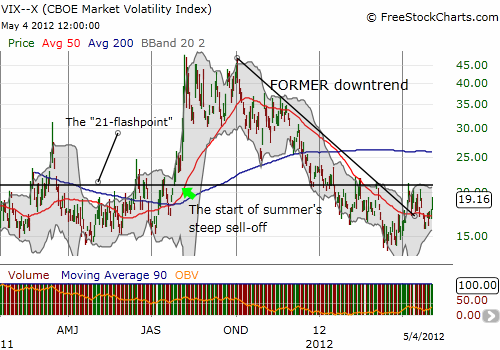
Friday’s pop allowed me to exit a position in VXX May 4 calls with a very slight profit. I am still holding a put in VXX, but my bias for future trades rests firmly with VXX calls now.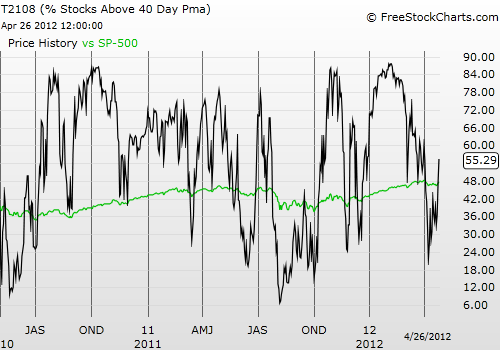
Black line: T2108 (measured on the right); Green line: S&P 500 (for comparative purposes)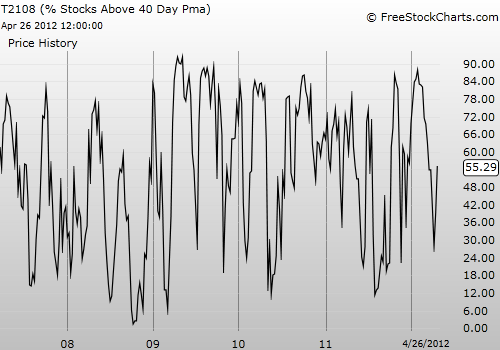
Be careful out there!
Disclosure: long SDS; long VXX put, long CAT shares and puts
- English (UK)
- English (India)
- English (Canada)
- English (Australia)
- English (South Africa)
- English (Philippines)
- English (Nigeria)
- Deutsch
- Español (España)
- Español (México)
- Français
- Italiano
- Nederlands
- Português (Portugal)
- Polski
- Português (Brasil)
- Русский
- Türkçe
- العربية
- Ελληνικά
- Svenska
- Suomi
- עברית
- 日本語
- 한국어
- 简体中文
- 繁體中文
- Bahasa Indonesia
- Bahasa Melayu
- ไทย
- Tiếng Việt
- हिंदी
S&P 500: Topping Pattern Developing
Published 05/06/2012, 01:36 AM
Updated 07/09/2023, 06:31 AM
S&P 500: Topping Pattern Developing
T2108 Status
3rd party Ad. Not an offer or recommendation by Investing.com. See disclosure here or
remove ads
.
Latest comments
Install Our App
Risk Disclosure: Trading in financial instruments and/or cryptocurrencies involves high risks including the risk of losing some, or all, of your investment amount, and may not be suitable for all investors. Prices of cryptocurrencies are extremely volatile and may be affected by external factors such as financial, regulatory or political events. Trading on margin increases the financial risks.
Before deciding to trade in financial instrument or cryptocurrencies you should be fully informed of the risks and costs associated with trading the financial markets, carefully consider your investment objectives, level of experience, and risk appetite, and seek professional advice where needed.
Fusion Media would like to remind you that the data contained in this website is not necessarily real-time nor accurate. The data and prices on the website are not necessarily provided by any market or exchange, but may be provided by market makers, and so prices may not be accurate and may differ from the actual price at any given market, meaning prices are indicative and not appropriate for trading purposes. Fusion Media and any provider of the data contained in this website will not accept liability for any loss or damage as a result of your trading, or your reliance on the information contained within this website.
It is prohibited to use, store, reproduce, display, modify, transmit or distribute the data contained in this website without the explicit prior written permission of Fusion Media and/or the data provider. All intellectual property rights are reserved by the providers and/or the exchange providing the data contained in this website.
Fusion Media may be compensated by the advertisers that appear on the website, based on your interaction with the advertisements or advertisers.
© 2007-2024 - Fusion Media Limited. All Rights Reserved.
