
: 32.1% (quasi-oversold; lowest point since Nov 20, 2012)
VIX Status: 18.6 (highest close since spike on Feb 25, 2013)
General (Short-term) Trading Call: Go long with tight stops, otherwise play breakdown from 50DMA
Active T2108 periods: Day #2 under 40% (underperiod), Day #15 under 70% (underperiod)
Commentary
The S&P 500 is now teetering on a clean breakdown. The setup going into Thursday is almost the exact opposite of what the market faced going into Monday’s trading. Then, I noted there was a good chance of a gap UP. Now, there is a good chance of a gap DOWN.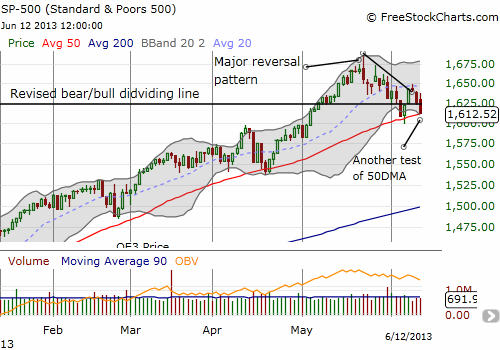
Supporting a sense of looming danger is the VIX. It closed at its highest point since February 25 when the S&P 500 plunged two days after my first discovery of quasi-oversold conditions. The S&P 500 rallied straight from there after not quite touching the 50DMA. However, this time is “different” because the index already retested the 50DMA just last weekend. As I noted in the last T2108 Update, such a rapid retest strikes me as a demonstration of waning buying power.
I warn of these hints of bearish signals with a sharp tinge of irony. While the T2108 Trading Model (TTM) is predicting a down day for Thursday, I find myself loaded up with call options on Pro Shares Ultra S&P 500 (SSO). How I got into this positioning taught me an interesting lesson in paying attention to the sensitivity of the TTM. The explanation is a bit involved – hang in there with me…
In the last T2108 Update, I noted that I would load up on Pro Shares Ultra S&P 500 (SSO) puts if the T2108 Trading Model (TTM) projected a down day off quasi-oversold conditions, especially with the wedge breaking to the down side. It did not take long to see that today would deliver the second big down day for T2108 to generate quasi-oversold conditions. The 2-day plunge at the close amounted to a whopping 29.1% loss. The intra-day chart makes plain the accelerating downward momentum. 
Eager to see what the model predicted, I ran the TTM and tweeted my results. TTM predicted an 83% chance of an up day for Thursday. Given the success of the last time I ran the model early, I set up buy orders for SSO calls. At least I low-balled the bids, recognizing the substantial downside risk remaining in the day as the S&P 500 steadily crept toward its 50DMA. All my orders promptly filled.
As I examined the decision tree associated with the model, it suddenly occurred to me that there were still scenarios where TTM would end up with a prediction of a DOWN day. In particular, if the VIX increased enough with T2108 plunging even more, TTM could predict follow-through selling for the next day. The model for the up prediction relied on the following branches (from bottom to top, skipping info that becomes redundant after knowing the terminal branch, and combining conditions where possible):
A 1-day change for T2108 >= -16.3% and A VIX change >= +0.5%
A T2108 close >= 18.6 and
There have been 18 occurrences of this scenario since 1990. The model contains 17 different terminal nodes (or scenarios) and only 8 of these predicted up days! In other words, a slight twist in the characteristic of the trading day could generate a different prediction. Sure enough, by the close, the TTM made an 180 degree turn on me by predicting a 75% chance of a DOWN day with a different decision tree. The prediction relied on the following branching (drawn with the same method as above):
A T2108 2-day change >= -31.3%
A T2108 Close A VIX Change >= +5.3%
There have been 8 occurrences of this scenario since 1990. The model contains 12 different terminal nodes (or scenarios) with half of these (6) predicting up days. I thought the relatively low frequency of occurrence provided an example of why the predictions for down days are less reliable than those for up days. However, in this case, the 2-day decline for T2108 produces a nearly equivalent classification error rate for up and down predictions (look up -0.3 on the x-axis and follow the graph upward until hitting the red and blue bubbles at that point). 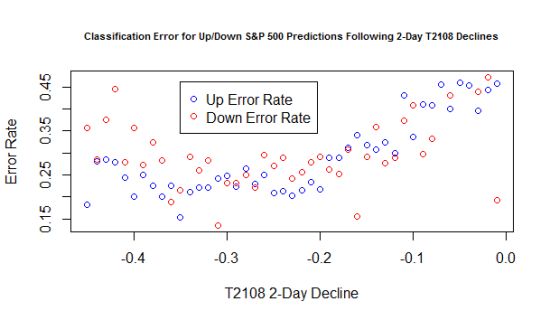
In other words, I really should have waited until a few minutes before the trading day to make a decision! Note well that this decision to wait will never be easy if the stock market is in the middle of a deep plunge: buying off oversold conditions can happen at any time and without warning. However, in THIS case, there was a reason to wait given my original inclination to go bearish on a break of key support levels. Regardless, I am still grateful for the ability to have this dilemma now that FreeStockCharts.com provides intraday data on T2108.
Here is how I will handle trading for Thursday. If I am lucky enough to get a strong open, I will relieve myself of my SSO calls relatively quickly under the assumption that a fade is coming. If the S&P 500 gaps down, I will just take my lumps and watch for a classic oversold condition (T2108
I end with this chart of Apple (AAPL). As I tweeted during the day, the stock is NOT looking good and is posied to "easily" retest May lows. It has broken through 50DMA support and closed right on top of the $532 pivot (2012's breakout point). Per the "ATM" (Apple Trading Model), I positioned with puts when AAPL rallied right into 20DMA resistance in order to get a discount on playing a weak close to the week. Note well that 20DMA is STILL trending downward and dominating trade this month even as overall the stock has essentially just churned for a month (or 5 months depending on your perspective!).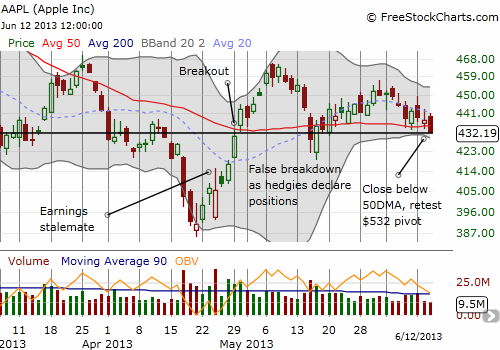

Black line: T2108 (measured on the right); Green line: S&P 500 (for comparative purposes)
Red line: T2108 Overbought (70%); Blue line: T2108 Oversold (20%)
Be careful out there!
Disclosure: long SSO calls; long AAPL shares and put spreads
- English (UK)
- English (India)
- English (Canada)
- English (Australia)
- English (South Africa)
- English (Philippines)
- English (Nigeria)
- Deutsch
- Español (España)
- Español (México)
- Français
- Italiano
- Nederlands
- Português (Portugal)
- Polski
- Português (Brasil)
- Русский
- Türkçe
- العربية
- Ελληνικά
- Svenska
- Suomi
- עברית
- 日本語
- 한국어
- 简体中文
- 繁體中文
- Bahasa Indonesia
- Bahasa Melayu
- ไทย
- Tiếng Việt
- हिंदी
S&P 500 Teetering On A Clean Breakdown
Published 06/13/2013, 07:01 AM
Updated 07/09/2023, 06:31 AM
S&P 500 Teetering On A Clean Breakdown
T2108 Status
3rd party Ad. Not an offer or recommendation by Investing.com. See disclosure here or
remove ads
.
Latest comments
Install Our App
Risk Disclosure: Trading in financial instruments and/or cryptocurrencies involves high risks including the risk of losing some, or all, of your investment amount, and may not be suitable for all investors. Prices of cryptocurrencies are extremely volatile and may be affected by external factors such as financial, regulatory or political events. Trading on margin increases the financial risks.
Before deciding to trade in financial instrument or cryptocurrencies you should be fully informed of the risks and costs associated with trading the financial markets, carefully consider your investment objectives, level of experience, and risk appetite, and seek professional advice where needed.
Fusion Media would like to remind you that the data contained in this website is not necessarily real-time nor accurate. The data and prices on the website are not necessarily provided by any market or exchange, but may be provided by market makers, and so prices may not be accurate and may differ from the actual price at any given market, meaning prices are indicative and not appropriate for trading purposes. Fusion Media and any provider of the data contained in this website will not accept liability for any loss or damage as a result of your trading, or your reliance on the information contained within this website.
It is prohibited to use, store, reproduce, display, modify, transmit or distribute the data contained in this website without the explicit prior written permission of Fusion Media and/or the data provider. All intellectual property rights are reserved by the providers and/or the exchange providing the data contained in this website.
Fusion Media may be compensated by the advertisers that appear on the website, based on your interaction with the advertisements or advertisers.
© 2007-2024 - Fusion Media Limited. All Rights Reserved.