
: 36.1%
VIX Status: 14.9
General (Short-term) Trading Call: Hold (aggressive traders who were short, should be stopped out. Bullish aggressive traders can buy on this breakout with a stop below 1600 or so to avoid whiplash)
Active T2108 periods: Day #7 over 20% (overperiod), Day #12 under 40% (underperiod), Day #31 under 70%
Commentary
The S&P 500 (SPY) finally broke through resistance at the 50-day moving average (DMA) on Friday. Three of the previous trading days featured attempts to break resistance that failed with fades. The strong close on the highs of the day happened only after some intraday drama which took the index back to flatline at one point.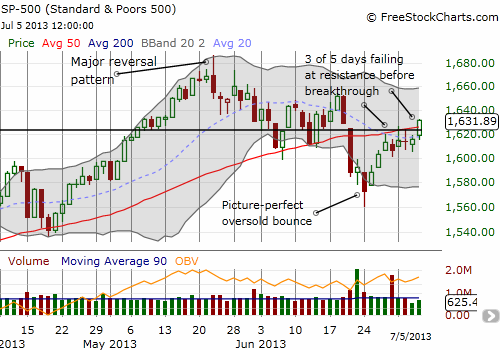
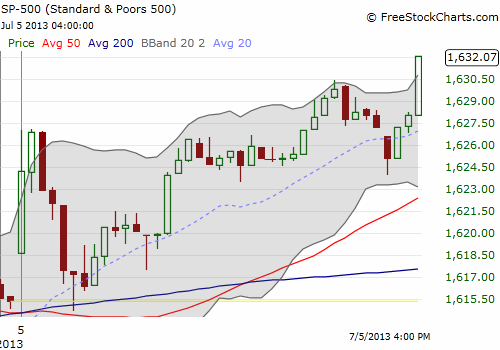
The intraday chart shows that the breakthrough likely has a lot of momentum. The bulls are taking control again.
As you might have guessed, this surge sent the volatility index, the VIX, plunging. It dropped 8.1% and has returned to familiar territory below the 15.23 pivot point. If the 2013 pattern holds, the VIX will stay below this important pivot for several weeks at a minimum. The implication is that the on-going rally will likely get new legs. With T2108 still at low levels (36.1%), there is plenty of room to run. Aggressive traders might want to play this breakout, but I prefer to wait for confirmation. A good one would be a close above June’s high. The upside target will stay capped at the May (and all-time) high. It is quite common, but certainly no guarantee, for the summer months to feature multiple retests of the May high (see “Trading Around May” – May 24, 2008).
There are also several developments potentially of interest for the T2108 underperiods.
The 70% underperiod has now reached its 31st trading day. The projection for the S&P 500 reaches its peak at this point. As a reminder, the graph below uses blue dots to show the historical S&P 500 performance by the number of days T2108 spends below the 70% threshold. The red dots show a projection based on this history (using a machine learning model called a support vector machine). From this point forward, the range of possible performances increases greatly by the time the S&P 500 reaches 70% again. The current 70% underperiod began on May 22nd, a major reversal day for the S&P 500. The index is currently down only 1.4% since then. 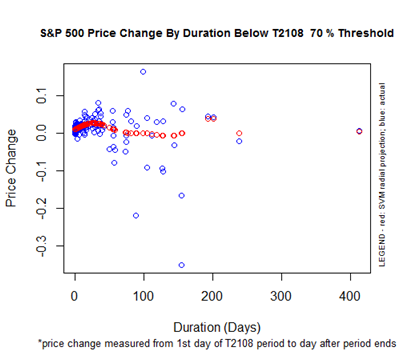
The S&P 500 is tracking expectations for the T2108 40% underperiod. This period began with the reversal of the false breakout on June 18th. The S&P 500 is essentially flat since then. Based on this projection, I expect the S&P 500 to end the 40% underperiod by Monday or Tuesday as it continues its rally.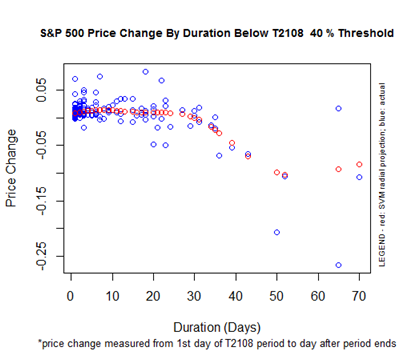
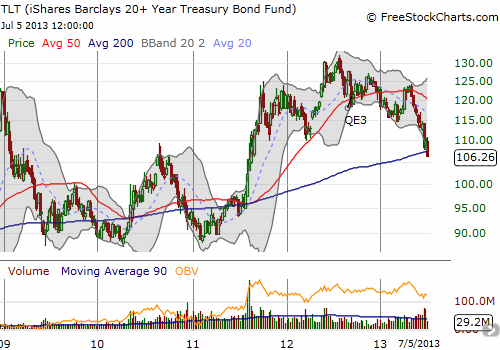
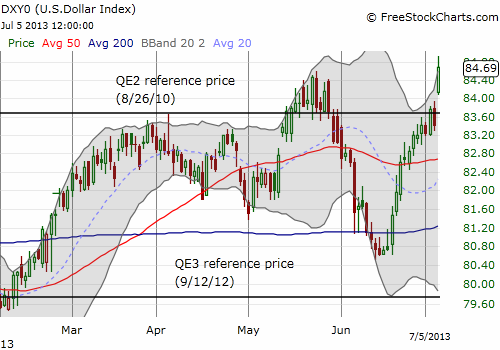
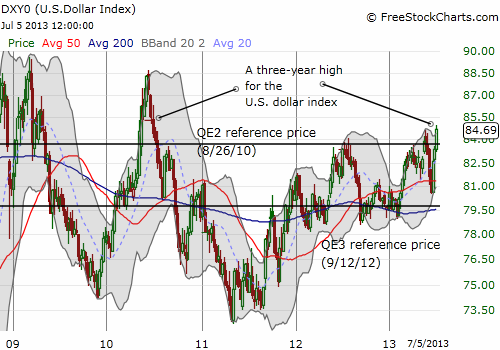
There are several developments that may anchor, or at least slow down bullish sentiments: higher interest rates (TLT), a higher dollar, and sinking emerging markets (EEM). Mind you, if the economy is truly turning the corner into a robust recovery, none of these factors will matter much. Regardless, these developments should serve to inject plenty of volatility into the path higher for the S&P 500 as the market vacillates in its interpretations of these signals, and the Fed scrambles to clarify its intentions. For now, I am betting on higher rates and lower emerging markets, but I am not convinced yet the U.S. dollar (UUP) can continue to rally. Here is the situation in pictures…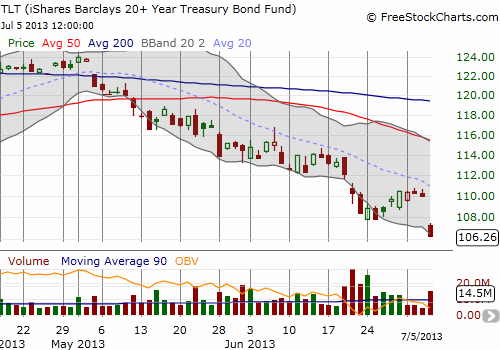
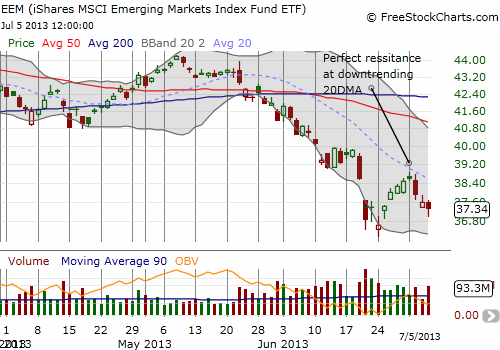
EEM continues to follow-through on its failure from resistance and underperformance versus the S&P 500
In the case of iShares MSCI Emerging Markets Index (EEM), I tweeted on July 1st how I was increasing my bearish bet against EEM with what was looking like an “evening star” pattern right at the downward trending 20DMA. This was a case where being aggressively bearish paid off well. I locked in profits on the new trades on the plunge the following day. I am still holding a large put spread position that expires next month.
Speaking of equities that are performing relatively poorly versus the S&P 500, Apple (AAPL) ended the week on a sour note. Stalled at its own 20DMA, AAPL could not continue its recent momentum to join the S&P 500 in Friday’s breakout. I assume the culprit was at least partially an earnings warning from Samsung. The company projected operating profit short of expectations. The segment below from Nightly Business report (starting at 5:45) implied that the problem was Samsung’s flagship Galaxy S4 phone, but never said it directly. Moreover, they did not make the direct connection between sales numbers at the high-end and the implication for the rest of the smartphone market.
NBR did do a good job of reminding the audience that Apple has been through several product cycles where obsolescence has given way to a new and exciting product. The replacement excitement for the iPhone better show up soon it seems (wearable tech?), or else the Apple Bottom will not likely hold. Taiwanese smartphone maker HTC piled on Friday with an apparently awful earnings report (strong sales, poor earnings). 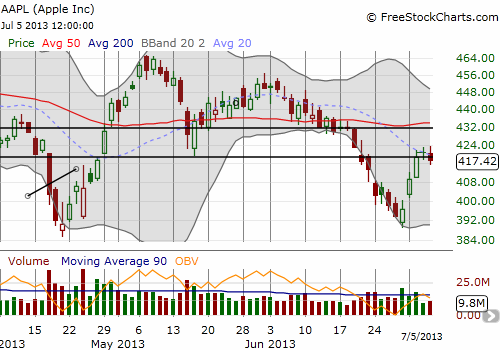
This was a great week for the Apple Trading Model (ATM) as the stock began the week strong and ended weakly as expected.
Finally, in other trading news, I completed another successful trade on Google (GOOG). This time I took it down to the wire with a 890/900 call spread that expired on Friday. I pinned the short side of the call spread to the highest point I thought GOOG could reach. So, by Friday’s open, GOOG only had to move a few points for me to cash in nicely. Of course, just a few points lower, and the trade would have been a complete bust. I am comfortable enough with these trades to start posting them on twitter (using the #120 hashtag) on a discretionary basis. I will definitely post them here on the T2108 Updates.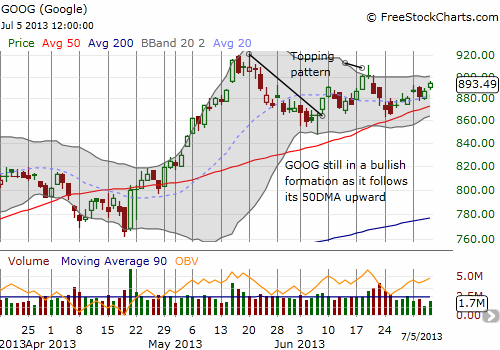

Black line: T2108 (measured on the right); Green line: S&P 500 (for comparative purposes)
Red line: T2108 Overbought (70%); Blue line: T2108 Oversold (20%)
Be careful out there!
Disclosure: long AAPL shares, calls, and puts; long EEM put spread; long TLT put spread; long TBT
- English (UK)
- English (India)
- English (Canada)
- English (Australia)
- English (South Africa)
- English (Philippines)
- English (Nigeria)
- Deutsch
- Español (España)
- Español (México)
- Français
- Italiano
- Nederlands
- Português (Portugal)
- Polski
- Português (Brasil)
- Русский
- Türkçe
- العربية
- Ελληνικά
- Svenska
- Suomi
- עברית
- 日本語
- 한국어
- 简体中文
- 繁體中文
- Bahasa Indonesia
- Bahasa Melayu
- ไทย
- Tiếng Việt
- हिंदी
S&P 500 Finally Makes A Breakthrough
Published 07/07/2013, 05:07 AM
Updated 07/09/2023, 06:31 AM
S&P 500 Finally Makes A Breakthrough
T2108 Status
3rd party Ad. Not an offer or recommendation by Investing.com. See disclosure here or
remove ads
.
Latest comments
Install Our App
Risk Disclosure: Trading in financial instruments and/or cryptocurrencies involves high risks including the risk of losing some, or all, of your investment amount, and may not be suitable for all investors. Prices of cryptocurrencies are extremely volatile and may be affected by external factors such as financial, regulatory or political events. Trading on margin increases the financial risks.
Before deciding to trade in financial instrument or cryptocurrencies you should be fully informed of the risks and costs associated with trading the financial markets, carefully consider your investment objectives, level of experience, and risk appetite, and seek professional advice where needed.
Fusion Media would like to remind you that the data contained in this website is not necessarily real-time nor accurate. The data and prices on the website are not necessarily provided by any market or exchange, but may be provided by market makers, and so prices may not be accurate and may differ from the actual price at any given market, meaning prices are indicative and not appropriate for trading purposes. Fusion Media and any provider of the data contained in this website will not accept liability for any loss or damage as a result of your trading, or your reliance on the information contained within this website.
It is prohibited to use, store, reproduce, display, modify, transmit or distribute the data contained in this website without the explicit prior written permission of Fusion Media and/or the data provider. All intellectual property rights are reserved by the providers and/or the exchange providing the data contained in this website.
Fusion Media may be compensated by the advertisers that appear on the website, based on your interaction with the advertisements or advertisers.
© 2007-2024 - Fusion Media Limited. All Rights Reserved.