The continued sale of risky assets last week favored the greenback and our exporters. Indeed, the DXY index, which measures the strength of the U.S. dollar against a basket of six currencies (including the euro, yen and loonie) ended the week at its highest level in a year. As long as politicians have not found a way to contain the contagion effects of a potential departure of Greece from the euro area, investors will continue to seek refuge in the US dollar. No solution emerged from the EU summit last Wednesday. Indeed, like the standoff between the Quebec government and the protestors, Germany does not bend to pressure from other countries in the euro area wanting to introduce eurobonds (funding mechanism shared by all eurozone members).
Canada
Again, the week will be thin in terms of economic statistics in Canada. The most important news is expected Thursday and Friday with the current account data and GDP figures respectively. GDP is expected to grow by 0.3% year over year. One week before the next Canadian Central Bank meeting, the GDP data will be scrutinized and will guide the speech of Mr. Carney.
United States
The economic calendar is quite full in the US this week. Tuesday, consumer confidence data will be known. Thursday, statistics of private sector employment reported by ADP will enter the scene, followed by the U.S. GDP (expected at 1.5%) and the level of personal consumption expenditure. The nonfarm payroll statistics and the ISM manufacturing index will end the week. Despite the fact that currently, all eyes are riveted on the European political situation, any negative news from the United States will add to the negative sentiment already weighing on the market. This would push the USD/CAD pair to levels not seen since December 2011. Market participants will be especially attentive to the result of the employment statistics of Friday since they fell short of analysts expectations for the past two months. Keep in mind that the Federal Reserve stands ready to react to sharp deterioration of the economy. With the end of Operation Twist in late June (coinciding with the next meeting of the Fed), these data will dictate Mr. Bernanke’s next move on the chessboard.
International
In addition to European developments which will necessarily hit the wires this week, we expect the German consumer price index Tuesday, followed by the retail sales data of that same country Wednesday. Thursday, the eurozone business climate indicator as well as the German employment statistics will be known. Analysts expect a job loss of 26k since the last reading. Friday’s unveiling of the German, Italian and eurozone purchasing manager index end the week of international statistics.
The Loonie
‘‘Don't judge each day by the harvest you reap but by the seeds that you plant." - Robert Louis Stevenson
Last week again proved eventful in Europe. The more-than-likely exit by Greece from the eurozone raised concerns in financial markets. This weighed down equity markets and spurred investors to seek out the U.S. dollar as a safe haven. The good news here is that Bloomberg, the information company, announced at the beginning of the month that Canadian banks dominate the list of the strongest banks in the world. Three of them ranked in the top 5, and six were in the top 22. These impressive results have inspired investor confidence in the Canadian financial system and have led several countries, including Russia, to make some adjustments, increasing the weighting of Canadian dollars in their reserves. These massive investments have clearly bolstered our loonie, which appears strong when compared with other currencies such as the Australian dollar and, of course, the euro (see the graph below). In these uncertain times, the U.S. dollar stands head and shoulders above the rest, with the U.S. Dollar Index (DXY) closing at 82.41, up 0.068 on Friday to a level not seen since September 13, 2010.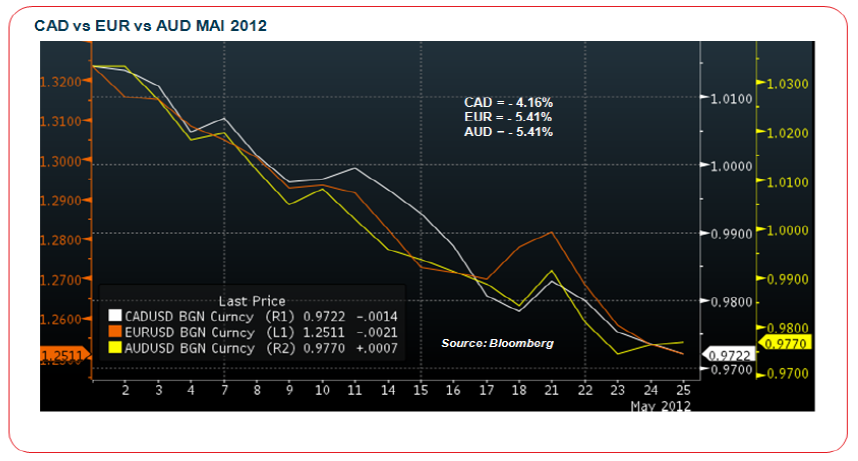
On June 17, the citizens of Greece will return to the ballot box. Markets will remain on edge, responding in the moment to every morsel of positive and negative news! A dip in the value of the euro will cause other currencies to slip against the U.S. dollar, commodities, metals and equity markets. The strong position enjoyed by Canadian banks has opened the door for them to do some bargain hunting. Since 2008, the banks have spent $37.8 billion to carry out close to a hundred acquisitions, and the strength of the loonie has encouraged acquisitions, particularly in the U.S. The banks’ strength should not last long. Canadian banks may face harder times in the future, as the consumer credit market cools off. The Royal Bank expects its revenues to rise only 7% in 2012, slightly more than half of the 13% increase posted in 2011. Food for thought.
Technical Analysis
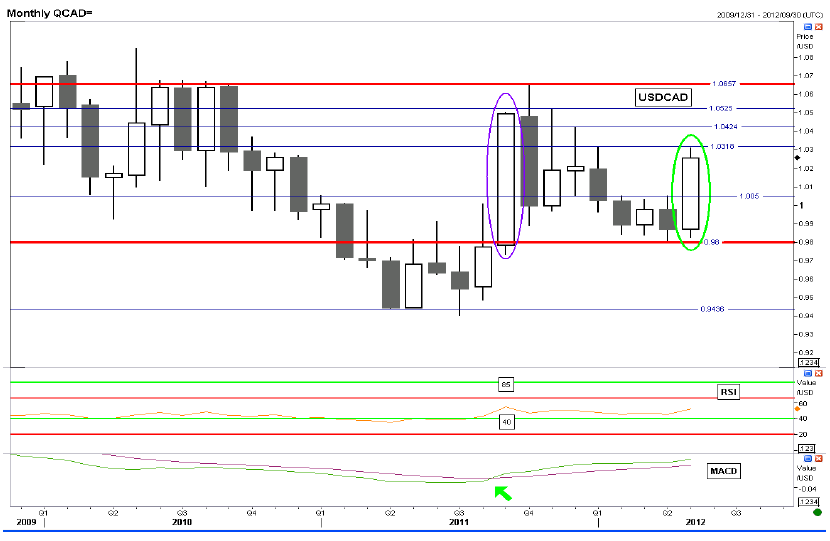
USD/CAD: The chart below in monthly studies displays a global view of the USD/CAD. The May candle (green circle), shows a very positive month, opening at around 0.9800 and closing in a few days around 1.0300. A 500-point rise is a clear change in sentiment in favour of the USD against the CAD. Furthermore, the USDCAD is now above its ascending 200-d moving average. It is also important to notice that the USD/CAD did not break below the month of September 2011 low. Around this date, the RSI pushed above 40 (bullish sign) and the MACD gave a clear buy signal (green arrow). Everything seems in place for a continuation of the bullish trend. Levels to watch on the top side: 1.0318, 1.0424, 1.0525 and 1.0657. To the downside, 1.0050 and 0.9800 will be major supports.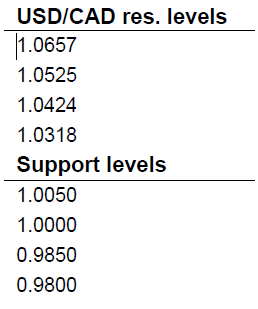
Fixed Income
Canadian bond and swap rates dropped to their early 2012 lows last week, as investors continued to keep a close eye on developments in Greece.
After the long weekend, yields had started on the rise on Tuesday, with investors reacting positively to the week-end discussions about the possibility of issuing so called eurobonds, debt issued by the eurozone as a whole, potentially allowing for cheaper funding in struggling countries.
Later in the week though, Germany showed resistance to the concept. Fears of a Greek exit from the euro led investors to buy safer assets, making government bond yields drop in Canada. Investors also reviewed lowered their forecasts for future interest-rate increases from the Bank of Canada.
Markets should remain highly volatile until the June 17 elections in Greece, which could be determinant for the future of the country inside the Union. In the meantime, most important economic releases are expected on Friday this week: May job numbers in the US and growth figures from Canada. Enjoy your week.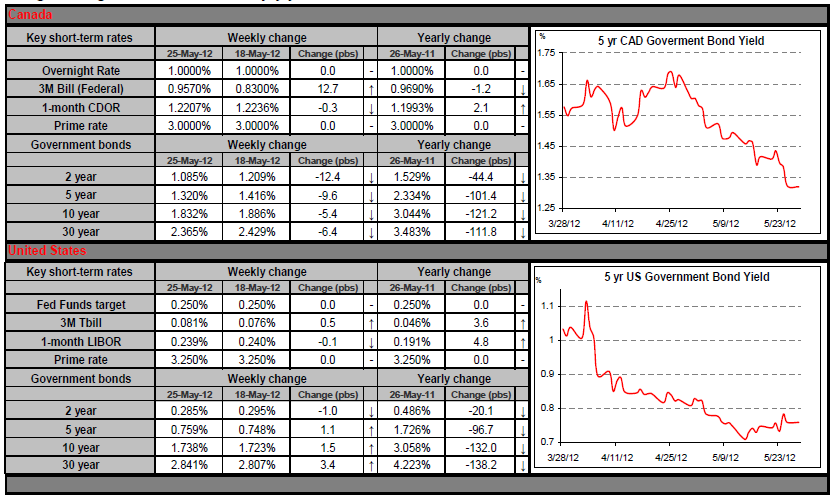
Commodities
After having slipped badly since the start of the month, energy prices have finally begun to stabilize. In May, prices for WTI, Brent crude, gasoline and heating oil have respectively fallen 10%, 7%, 6% and 7% (in Canadian dollars). Last week the situation with Iran captured our attention. Negotiations held in Baghdad between Iran and six of the world’s major pow (France, Russia, the United States, Great Britain, China and Germany) gave no concrete results and revealed that significantly different points of view remain to be reconciled. Following these two days of negotiations, Hillary Clinton, the U.S. Secretary of State, stated that U.S. sanctions will remain in place as long as visible progress has not been made. The next round of discussions will be held in Moscow on June 18 and 19. This week we will be closely watching the situation in Europe and potential action by the Chinese government to restart the country’s economy.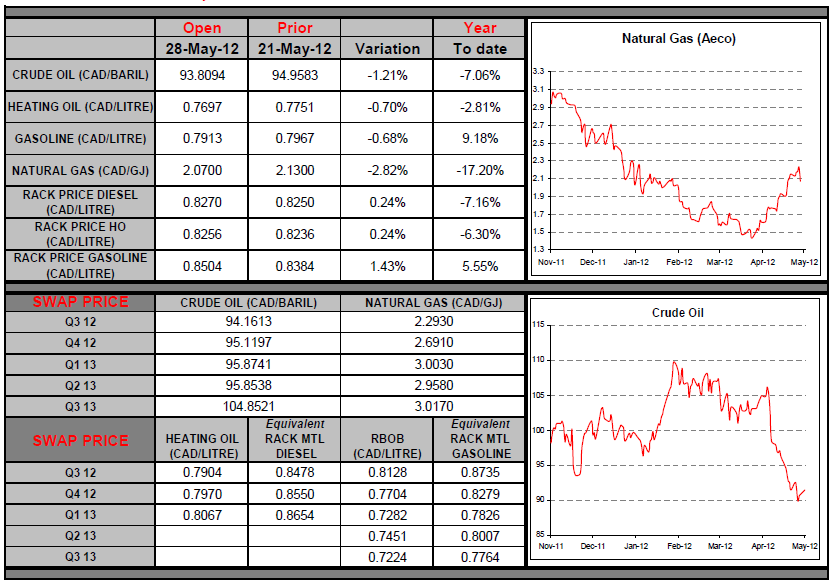
Last Week At A Glance
CanadaRetail sales rose 0.4% in March helped by auto dealership revenues. Excluding autos, however, retail sales were much weaker than expected, rising just 0.1%. Gains in sales of building materials, electronics, clothing and sporting goods were largely offset by declines elsewhere, including a 1.6% drop in gasoline sales. In real terms, retail sales rose 0.4% as well. Among the provinces, Alberta continued to lead the nation with retail sales up 9% over March of last year. Even with March's advance, real retail sales in the country rose just 0.2% annualized in 2012Q1, their slowest pace since 2011Q1. This suggests consumers made a limited contribution to GDP in the quarter.
Operating profits generated at home by Canadian corporations were virtually unchanged in 2012Q1. In the non-financial sector, profits declined $3.4 billion, or 5.9%, with most of the decrease concentrated in manufacturing (-$2.6 billion) and telecoms (-$1.3 billion), where earnings recorded an outsized gain in 2011Q4. The sector’s profits in 2011Q4 were revised up 8.2% ($4.4 billion). This is remarkable in that the profits reported by the oil and gas industry were only a quarter of those registered at the pre-recession peak. Hence, productivity could be revised up when the national accounts are released at the beginning of next month. As for the financial sector, profits jumped $3.5 billion in the quarter, their highest level since 2007Q3. The increase was led by life insurance companies, which registered lower actuarial liability adjustments.
The Institut de la statistique du Québec reported that Quebec real GDP at basic prices was flat in February after retreating 0.3% in January (versus -0.2% and +0.1, respectively, for Canada). Goods production edged up 0.1% in the month as higher production in the manufacturing sector offset weakness elsewhere. Output in the service sector held steady, with a decline in professional, scientific and technical services offset by a combined 0.5% gain across finance, insurance, real estate, leasing, and business. Despite the weak numbers reported for January and February, the strong December handoff still leaves Quebec on track to record real GDP growth of about 0.7% annualized in 2012Q1.
United States
Further evidence emerged that the U.S. housing market was stabilizing. Existing-home sales in April rose 3.4% to 4.62 million units, more than reversing the prior month’s decline. Both singles and multiples moved up (3% and 6%, respectively). The median sale price rose for a third consecutive month and attained its highest mark since July 2010. Despite increasing slightly, the months’ supply of homes remained near a six-year low. Still in April, new-home sales rose 3.3% over the month before. The median new-home price rose to $235,700, up 4.9% year on year. The supply of homes at the current sales rate dropped one tick to 5.1 months. Not counting February's 4.9 print, this was the lowest inventory of homes for sale since 2005.
With the supply of new homes remaining relatively low, there is upside potential for both prices and housing starts. This explains perhaps why the NAHB builder confidence index is currently at a five-year high. Durable goods orders rose 0.2% in April, driven by the transportation component. However, ex-transportation orders sagged 0.6%, well short of consensus expectations. Non-defence capital goods orders excluding aircraft, a gauge of future investment spending, sank 1.9% after dropping 2.2% the previous month. Total shipments of durable goods sprang 0.7% overall, but slipped 0.3% excluding transportation. Shipments of non-defence capital goods ex-aircraft fell 1.4%. This hints at a possible deceleration in investment in Q2.
Weekly initial jobless claims dipped to 370K from an upwardly revised 372K, in line with consensus. The more reliable fourweek moving average fell to 370K, for a third drop in a row. Continuing claims dropped 29K to 3.26 million. The flash/preliminary estimate of Markit's US manufacturing PMI came in at 53.9 for the month of May. Even though that's a brand new release, Markit provided historic data. So May's 53.9 print compares with April's 56 print and an average of 54.6 in Q1 and 54.3 for 2011 as a whole. Still, a reading above 50 implies expansion in manufacturing activity. In May, all of the major sub-indices (output, new orders, employment) were in expansion territory albeit a touch lower than in April.
All told, the above-50 print in the PMI points to continued expansion of the US economy in Q2, although we're seeing a slight moderation. The final read on the Michigan consumer sentiment indicator for May showed an increase to 79.3 (versus the preliminary reading of 77.8). This is the highest mark reached since October 2007. In May, consumers felt more confident about both current conditions and the economic outlook. The cycle high attained by the Michigan index is rather encouraging with respect to consumer spending. Lower gas prices may be a factor in the matter.
Eurozone
The news has gone from bad to worse for the eurozone, which has to contend not only with political gridlock but also a deepening recession. The Markit Eurozone flash estimate for May’s purchasing managers index showed a decline to 45.9, its lowest level since mid-2009. Europe’s two powerhouses– Germany and France–saw their respective manufacturing PMIs decline sharply, which pushed them even deeper into contraction territory. Separately, Germany’s IFO business climate index dropped sharply in May, erasing in one fell swoop all of the gains of the preceding five months.
