
The commodity currencies were the big losers last week, together with the pound, while the yen, Swiss franc and precious metals – the “safe haven” assets -- were the big winners These are all indications of a “risk off” trade, but which risks? The poor performance of the commodity currencies, together with lower energy prices and mixed prices of industrial metals, suggest fears about growth. That stems from concern about the Fed’s “tapering off” its support for the financial markets and what that might do to the real economy, plus worries about Chinese growth after last week’s purchasing managers’ index (PMI) signalled that manufacturing is contracting. Fears over Chinese growth heightened over the weekend, when Chinese President Xi Jinping said the country won’t sacrifice the environment to ensure short-term growth – in other words, that they would tolerate slower growth to improve the environment. AUD tends to be the most vulnerable currency in such an environment, particularly when China is involved.
Besides the Fed and China, the other main source of risk – and hence “risk off – is Japan, where quantitative easing isn’t working out exactly as planned. Bond yields have been moving higher on expectations of higher inflation, and higher yields are unnerving stocks. There was more cause for concern over the weekend after Bank of Japan Gov. Kuroda didn’t say he was going to do anything about this vicious circle and instead just cited a BoJ report indicating that rates could rise 1-3 ppt in an improving economy without causing instability. The reason for the decline in USD/JPY must have more to do with the use of JPY as a funding currency than an evaluation of the risks that the currency faces however, because it makes little sense to buy a currency specifically because of turmoil in that country’s financial markets. Nonetheless there is a positive (+0.55) correlation between Japanese stocks and USD/JPY, hence a lower stock market means a lower USD/JPY.
It’s significant that the dollar is weakening against most currencies during this period of “risk off” even though one of the main causes of the risk aversion is the likelihood of higher interest rates in the US. That idea was supporting the dollar in the immediate wake of Mr. Bernanke’s speech on Wednesday, as one might expect, but the turmoil in Japan seems to have changed the mood into one of general position-cutting that includes cutting long USD positions. I can’t see this period lasting too long however. Central banks accounting for some 27% of global GDP have either eased recently or have easing biases, meaning there should still be plenty of liquidity going forward. It only means carry trades should eventually shift out of USD and into JPY and CHF. I would particularly urge investors to consider a long-term position in EUR/CHF, where the Swiss National Bank is providing downside support.
Meanwhile, the weaker dollar and fears of financial instability are supporting the precious metals, but silver more than gold. In fact, all of last week’s move in gold occurred on Monday; this morning it’s still a few dollars lower than it was at the end of trading a week ago. It doesn’t make any sense for gold to rally on the possibility of an end to QE, since of course excess liquidity, negative real interest rates and the fear of hyperinflation caused by QE were among the factors pushing gold up. The gold/silver ratio, which bottomed last November, hit 61.9 on Friday, the highest level since Sep. 2010.
There are no major indicators or speeches scheduled for today and with the UK and US on holiday, I expect a quiet day driven largely by technical factors. For the week as a whole, the key data points are the German inflation figures on Wednesday and Eurozone inflation on Friday, which will prepare the way for next week’s ECB meeting. A slightly rise in Eurozone inflation may dampen expectations of another rate cut and support EUR/USD.
The Market
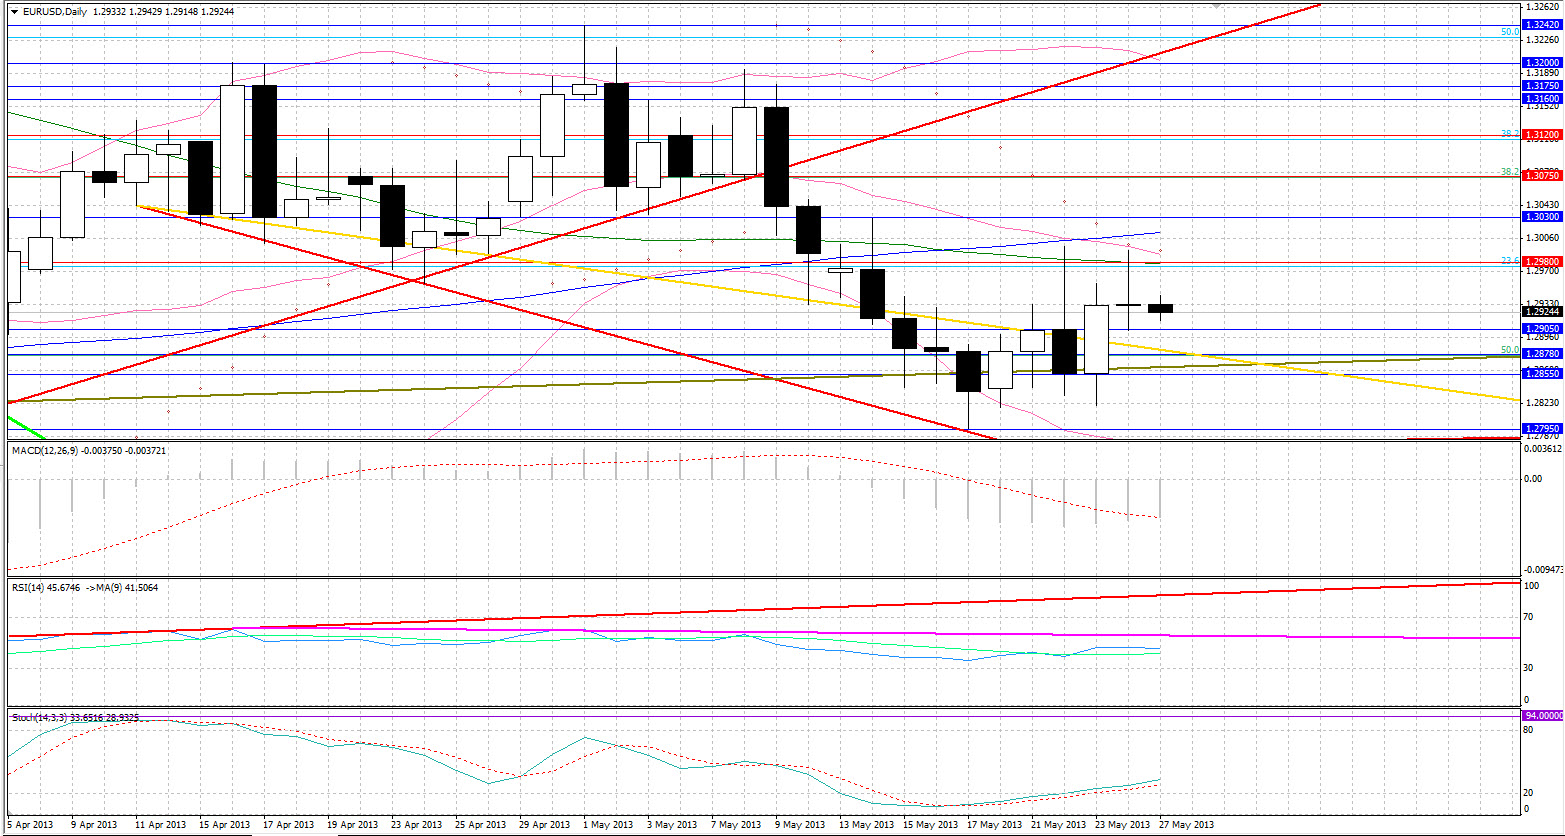
EUR/USD
 EUR/USD" title="EUR/USD" width="1324" height="665">
• EUR/USD ended Friday slightly lower, forming a long-legged doji candle. This candle is a bearish signal which seems to be confirmed so far given the slight overnight losses. A support which should cause some movement upon breakout can be found at 1.2880 followed by 1.2780, the November rising trendline support and the bottom Bollinger Bands level. Resistance is to be found at 1.2980, the 20 day moving average, followed by a strong resistance at 1.3075.
USD/JPY 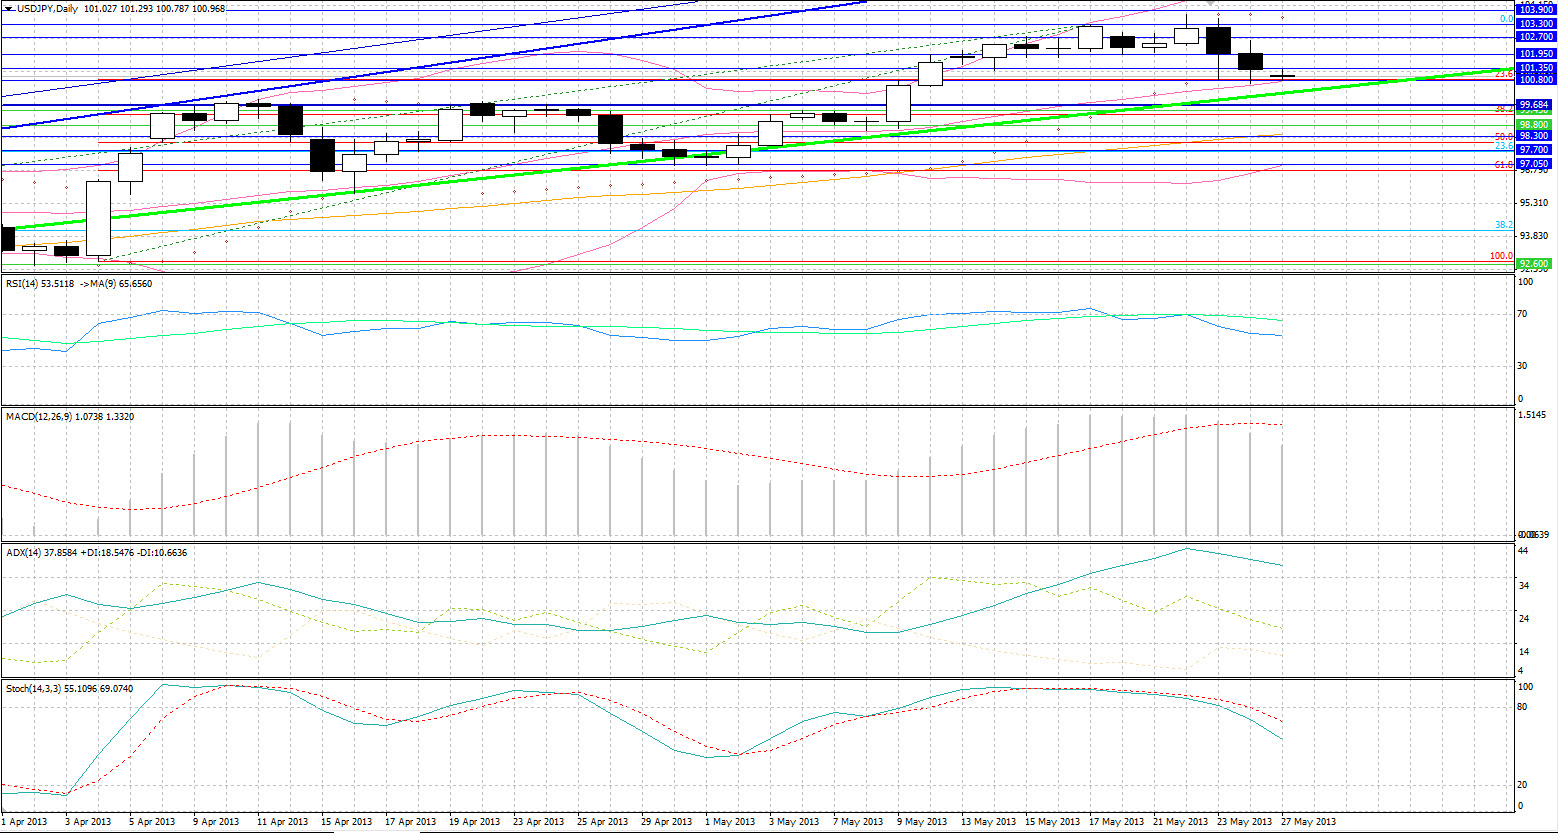 USD/JPY" title="USD/JPY" width="1324" height="665">
• USD/JPY suffered losses for a second consecutive day and continues to move lower this morning. On Friday the pair recovered somewhat in New York trading but was unable to break through the low set in the wake of Mr. Bernanke’s testimony last week. That failure caused a turnaround in sentiment. There is substantial support in the 100.70- 100.40 area, where there is a bottom Bollinger bands level, a 20 day moving average and 23.6% up move retracement level. A break of 100.40 could see the pair test previous resistance level of 99.70. Resistance levels can be found at 101.90 and 102.70.
AUD/USD 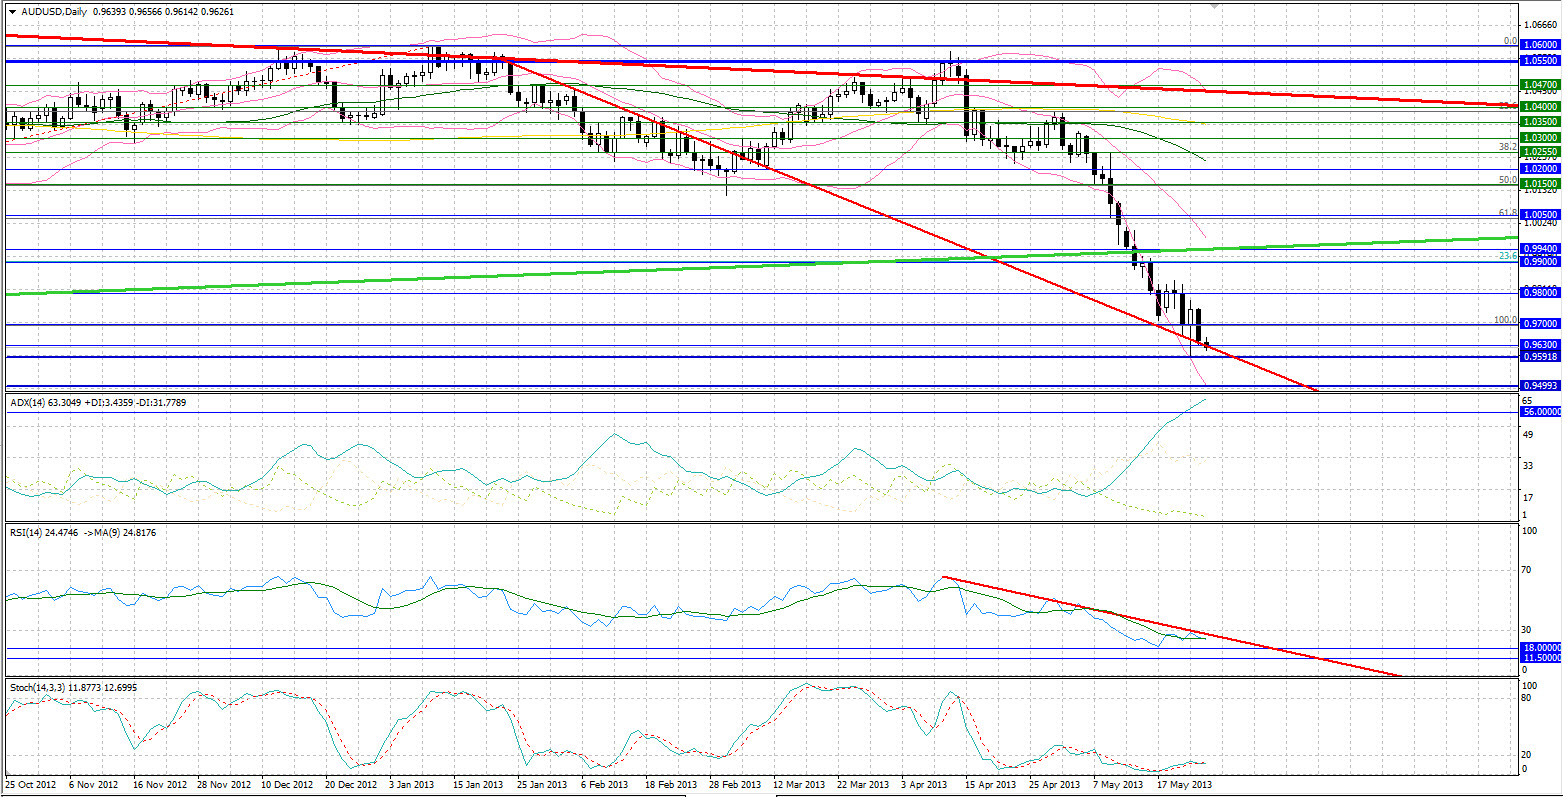 AUD/USD" title="AUD/USD" width="1324" height="665">
• AUD/USD continues its massive drop since the start of the month, having lost 750 pips, with the ADX index showing higher and higher reading confirming the strength in this down trend. At the time of writing the pair is finding support at 0.9630, Friday’s low and falling trendline support, while 0.9590, Thursday’s low being expected to be re-tested. A break of this level could see the pair drop to 0.9500 which is a 2 year low. Resistance can be found at 0.9700 and 0.9800.
Gold
• Gold fell slightly on Friday following a sluggish trading session, with the $1400 resistance level being tested and holding for a seventh trading day. Once again gold is very close to $1400 resistance level, which upon breakout should see gold test the $1430 level and $1445 in succession. The metal is finding support at $1485, Friday’s low and the 23.6% retracement of its down move. Further support remains at $1350 -$1340 area followed by $1320.
Oil
• WTI resumed its drop on Friday with the $93.50 level, a previous low and 3-year rising trendline support, holding once again and being tested this morning. A break of this level makes $92.20 support highly likely to be revisited followed by $91.30. Resistance levels remain the $94.50 level followed by $95.00.
BENCHMARK CURRENCY RATES - DAILY GAINERS AND LOSERS

- English (UK)
- English (India)
- English (Canada)
- English (Australia)
- English (South Africa)
- English (Philippines)
- English (Nigeria)
- Deutsch
- Español (España)
- Español (México)
- Français
- Italiano
- Nederlands
- Português (Portugal)
- Polski
- Português (Brasil)
- Русский
- Türkçe
- العربية
- Ελληνικά
- Svenska
- Suomi
- עברית
- 日本語
- 한국어
- 简体中文
- 繁體中文
- Bahasa Indonesia
- Bahasa Melayu
- ไทย
- Tiếng Việt
- हिंदी
Risk Off Trade, Again
Published 05/27/2013, 03:27 AM
Updated 07/09/2023, 06:31 AM
Risk Off Trade, Again
3rd party Ad. Not an offer or recommendation by Investing.com. See disclosure here or
remove ads
.
Latest comments
Install Our App
Risk Disclosure: Trading in financial instruments and/or cryptocurrencies involves high risks including the risk of losing some, or all, of your investment amount, and may not be suitable for all investors. Prices of cryptocurrencies are extremely volatile and may be affected by external factors such as financial, regulatory or political events. Trading on margin increases the financial risks.
Before deciding to trade in financial instrument or cryptocurrencies you should be fully informed of the risks and costs associated with trading the financial markets, carefully consider your investment objectives, level of experience, and risk appetite, and seek professional advice where needed.
Fusion Media would like to remind you that the data contained in this website is not necessarily real-time nor accurate. The data and prices on the website are not necessarily provided by any market or exchange, but may be provided by market makers, and so prices may not be accurate and may differ from the actual price at any given market, meaning prices are indicative and not appropriate for trading purposes. Fusion Media and any provider of the data contained in this website will not accept liability for any loss or damage as a result of your trading, or your reliance on the information contained within this website.
It is prohibited to use, store, reproduce, display, modify, transmit or distribute the data contained in this website without the explicit prior written permission of Fusion Media and/or the data provider. All intellectual property rights are reserved by the providers and/or the exchange providing the data contained in this website.
Fusion Media may be compensated by the advertisers that appear on the website, based on your interaction with the advertisements or advertisers.
© 2007-2024 - Fusion Media Limited. All Rights Reserved.