Welcome to the first week of March – probably my favorite month of the year…
The days are getting longer (and warmer), we’ve got daylight savings time coming up at the end of the week, baseball pre-season has started, and the March Madness basketball tournaments are just around the corner.
March is looking like an interesting month for equity traders as stock prices perform their own version of the pick and roll maneuver. On Friday, the broad indices backed off from their recent highs – but the weakness was particularly acute in the S&P Smallcap Index which dropped 1.6%.
This action put the Smallcap Index below a tight consolidation it formed throughout the month of February – and it now looks like the index is stalling out at a key resistance area on a long-term chart. If the Smallcaps follow through on Friday’s breakdown, it will be a major sentiment shift for speculative traders.
The prospect of a “risk-off” move – with bulls fleeing to the sidelines – has us watching our risk points carefully and looking for opportunities to set up counterbalance trades that will help to offset our current bullish posture. There are a number of key sectors that are either reversing at key resistance points, or have already established bearish trends. The key is finding proper entry points that allow us to set reasonable risk points – and have expectations for a strong reward-to-risk ratio.
Below are some of the area’s we’re tracking for potential trades this week:
Discount Retailers Stalling Out
It’s a tough time to be making a living by selling products to budget-conscious consumers…
Despite the “global economic rebound,” the majority of shoppers are still very price sensitive, seeking the best value for their dollar. Over the past two years, we have seen a widening chasm between the “have’s” (affluent customers with plenty of money to spend) and the “have-not’s” (price sensitive consumers struggling with tight budgets).
Retailers who have always catered to the low-price consumer did well initially. After all, their target market broadened much faster than the increase in competition.
But over the past few quarters, middle-of-the-road retailers have been adjusting their product lines to capture market share from these deep-discount retailers, creating a more competitive environment for all.
Late in February, we saw a sharp break in Wal-Mart (WMT) as the company announced that it was struggling to maintain attractive profit margins. This was a direct result of new competition in the discount retail market. Last week we noted the declining patterns for retail stocks – and put readers on notice for potential short setups in the near future. From our Live Feed:
"Retailers are realizing that they either need to compete on price or on quality – and it’s a lot easier to drop prices than to reinvent brands to a higher quality standard. This means more retailers are cutting prices (and cutting profit margins) in an attempt to capture a bigger slice of the low-end consumer demographic…
So after two years of broad advancement, we’re seeing cracks in the trends for a few key discount retailers. This week, WMT and Family Dollar Stores (FDO) look particularly interesting with short-term flag (drift) patterns within the context of larger topping formations." ~ February 27th, 2012
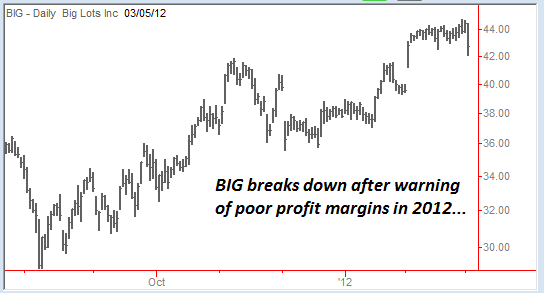
On Friday, Big Lots Inc. (BIG) broke down sharply after reporting fourth quarter earnings that beat estimates, but at the same time issued guidance for lower margins in 2012. As discount chains break down and then consolidate or drift, we should be able to set up numerous short trades in the months ahead.
For-Profit Education – Pressure From All Sides
Education stocks have had more than their share of ups and downs over the past few years. As employment numbers dropped, investors flocked to education companies because they believed that laid off workers would have incentive to beef up their education to qualify for better jobs.
But the group ran into severe regulatory issues after it came to light that Federal student financing programs were helping students get their degrees – but the degrees were often useless in terms of leading to employment that provides enough income to cover the education costs.Taxpayers were paying for defaulted loans, and the Fed began investigating enrollment practices, and graduation rates.
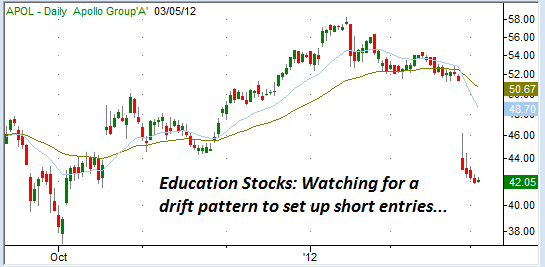
Over the last few quarters, the group finally got relief as it looked like the regulatory hurdles had been cleared, and new standards for enrollment were in place. But last week, Apollo Group (APOL) dropped a bomb on the sector – warning of lower enrollment due to the new standards.
Education stocks arre now reversing their 2011 gains and look extremely vulnerable. In addition to the regulatory issues, the most recent employment reports have been encouraging – showing more job growth. Whether you believe the published employment data or not, the perception of a better jobs market may encourage would-be students to go ahead and move into the work-force. It’s certainly something on the mind of investors in the for-profit education sector.
Now that APOL has gapped sharply lower, we’re watching names in the group for “drift” patterns. A stock that breaks down suddenly, is likely to continue the pattern as investors look for opportunities to bail out. As traders, we want to see a consolidation first – giving us a chance to short on a continuation move – with a reasonable risk point above the high of the drift pattern.
Oil Service Stocks Perk Up
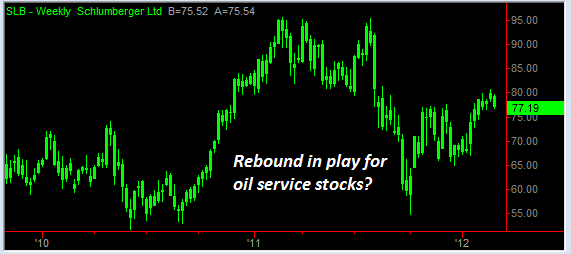
With oil prices continuing to hold above $100 per barrel, oil service companies are seeing improvement in their business. After bottoming in the fourth quarter last year, several of these names have set up healthy bases and now sport bullish formations.
Schlumberger Ltd. (SLB) looks particularly interesting after breaking above resistance in February – and now drifting back to key EMA support. The stock has a 1.4% dividend yield, which is attractive in the current “zero rate” policy environment, and analysts expect earnings growth to increase more than 20% both this year and next year.
A new surge higher would represent an interesting buy opportunity as the breakout would be confirmed. Even in an environment where small caps break down and managers reduce risk, SLB could hold up well based on its defensive characteristics – along with an attractive valuation and dividend yield.
Last week’s fade could embolden the bears and invite short sellers to step back into the fray. Or we could see renewed buying as bulls defend the trend and use the pullback as a buying opportunity.
This is a tricky spot with plenty of good arguments for both camps. The beauty of the situation for us is that we don’t have to hold an allegiance to either side of the argument.
Using price action as our key indicator, we can dial up the exposure, or cut back quickly – and we have plenty of great setups for either camp – should one group emerge the clear victor.
So this week, manage your risk carefully, pay attention to the indicators, and keep an open mind in terms of direction. Opportunities abound for traders who keep their capital intact.
- English (UK)
- English (India)
- English (Canada)
- English (Australia)
- English (South Africa)
- English (Philippines)
- English (Nigeria)
- Deutsch
- Español (España)
- Español (México)
- Français
- Italiano
- Nederlands
- Português (Portugal)
- Polski
- Português (Brasil)
- Русский
- Türkçe
- العربية
- Ελληνικά
- Svenska
- Suomi
- עברית
- 日本語
- 한국어
- 简体中文
- 繁體中文
- Bahasa Indonesia
- Bahasa Melayu
- ไทย
- Tiếng Việt
- हिंदी
Risk-Off Move on the Horizon?
Published 03/06/2012, 12:36 AM
Updated 07/09/2023, 06:31 AM
Risk-Off Move on the Horizon?
3rd party Ad. Not an offer or recommendation by Investing.com. See disclosure here or
remove ads
.
Latest comments
Install Our App
Risk Disclosure: Trading in financial instruments and/or cryptocurrencies involves high risks including the risk of losing some, or all, of your investment amount, and may not be suitable for all investors. Prices of cryptocurrencies are extremely volatile and may be affected by external factors such as financial, regulatory or political events. Trading on margin increases the financial risks.
Before deciding to trade in financial instrument or cryptocurrencies you should be fully informed of the risks and costs associated with trading the financial markets, carefully consider your investment objectives, level of experience, and risk appetite, and seek professional advice where needed.
Fusion Media would like to remind you that the data contained in this website is not necessarily real-time nor accurate. The data and prices on the website are not necessarily provided by any market or exchange, but may be provided by market makers, and so prices may not be accurate and may differ from the actual price at any given market, meaning prices are indicative and not appropriate for trading purposes. Fusion Media and any provider of the data contained in this website will not accept liability for any loss or damage as a result of your trading, or your reliance on the information contained within this website.
It is prohibited to use, store, reproduce, display, modify, transmit or distribute the data contained in this website without the explicit prior written permission of Fusion Media and/or the data provider. All intellectual property rights are reserved by the providers and/or the exchange providing the data contained in this website.
Fusion Media may be compensated by the advertisers that appear on the website, based on your interaction with the advertisements or advertisers.
© 2007-2024 - Fusion Media Limited. All Rights Reserved.
