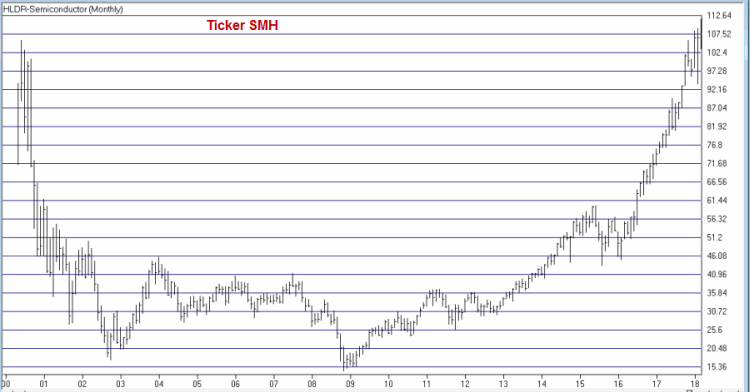
When semiconductors go, they really ”go.” Unfortunately, when they tank, they really “tank”. Even a quick glimpse of Figure 1 makes this quite obvious. Figure 1 displays ticker SMH – an ETF (VanEck Vectors Semiconductor) that tracks and index of semiconductor stocks. It displays a lot of “swooping” and “soaring” – with a distinct emphasis on (searing?) “soaring” in recent years.
So the obvious questions are:
a) Are things a bit overdone on the upside?
b) What comes next?
Unfortunately, because I am not very good at “predicting” things, I personally can provide only my stock answers of:
a) Maybe (OK, probably).
b) It beats me.
But let’s not stop right there. Let’s consider the seasonality of semi stocks.
FSELX Bull/Bear Months
For testing purposes we will use ticker FSELX Fidelity Select Semiconductors which started trading in 1986.
We will refer to the November 1st through May 31st period as the “bullish” months, and;
To the June 1st through October 31st period as the “bearish” months.
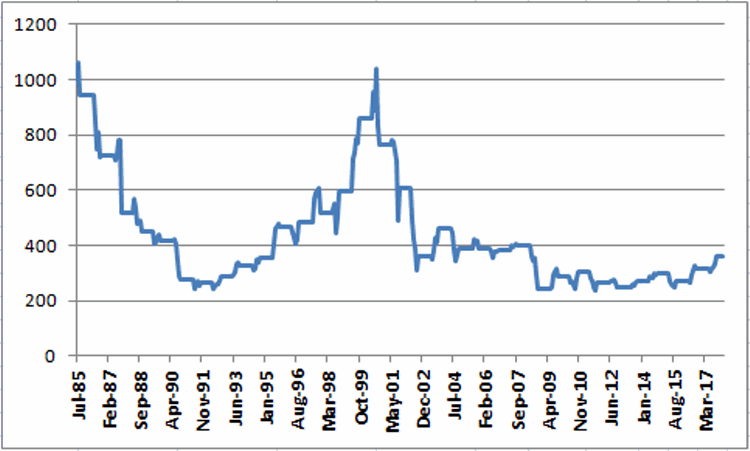
Figure 2 displays the growth of $1,000 invested in ticker FSELX only during the “bearish” months since the fund started trading in 1986.

$1,000 invested in ticker FSELX only during June through October declined -64% to $363.
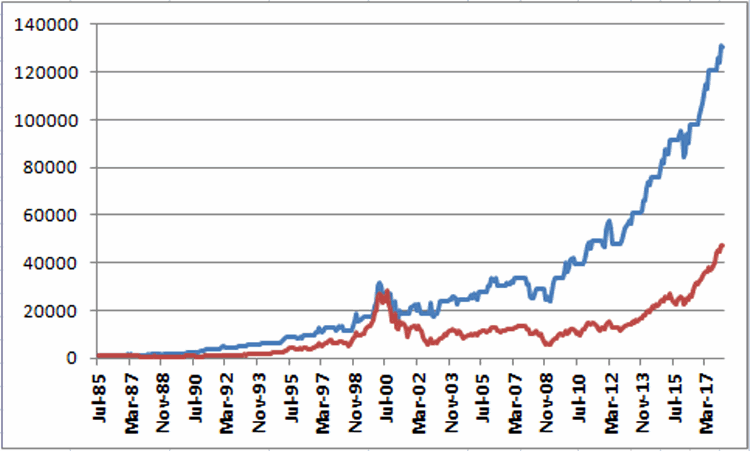
Figure 3 displays the growth of $1,000 invested in FSELX only during the Nov. 1 through May 31st period every year (blue line) versus simply buying and holding FSELX.

For the record:
*$1,000 invested in FSELX only during Nov 1 through May 31 grew +12,951% to $130,514 by the end of February 2018 (the gains to date during March 2018 are not included here).
*$1,000 invested in FSELX on a buy-and-hold basis grew by +4,638% to $47,383 during the same period.
Will semiconductor stocks (and correlated funds and ETFs) continue to rally through the end of May? Stock answer time again: it beats me. For the record, the March/Apr/May period combined has seen FSELX post a net gain 26 times in 32 years (81% of the time).
Disclaimer: The data presented herein were obtained from various third-party sources. While I believe the data to be reliable, no representation is made as to, and no responsibility, warranty or liability is accepted for the accuracy or completeness of such information. The information, opinions and ideas expressed herein are for informational and educational purposes only and do not constitute and should not be construed as investment advice, an advertisement or offering of investment advisory services, or an offer to sell or a solicitation to buy any security.
