Due to an across-the-board sell-off that's occurred, so far, this week in equities, I thought I'd take a mid-week look at the 6 Major Indices and 9 Major Sectors to see which ones have been holding up somewhat better than the others.
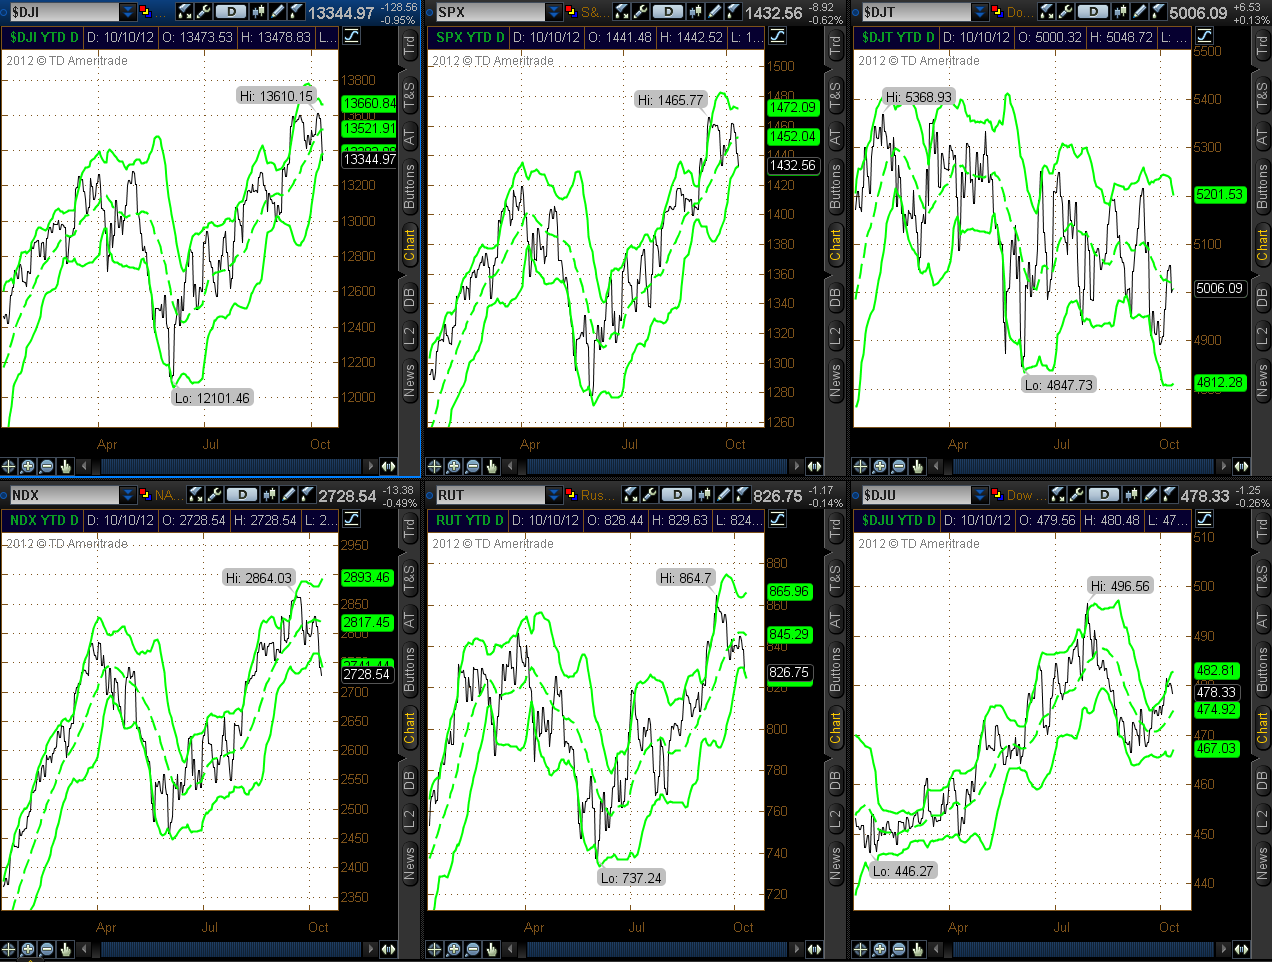
From the Daily line chart of the Major Indices shown below, the two Indices that haven't reached their lower Bollinger Band by today's (Wednesday's) close are the Dow Transports and Dow Utilities. They are, however, underperforming the other four Indices in terms of performance from July.
The 3-day percentages gained/lost graph confirms this. The biggest losses, so far this week, have been in the Nasdaq 100 Index, followed by the Dow 30, S&P 500, and Russell 2000.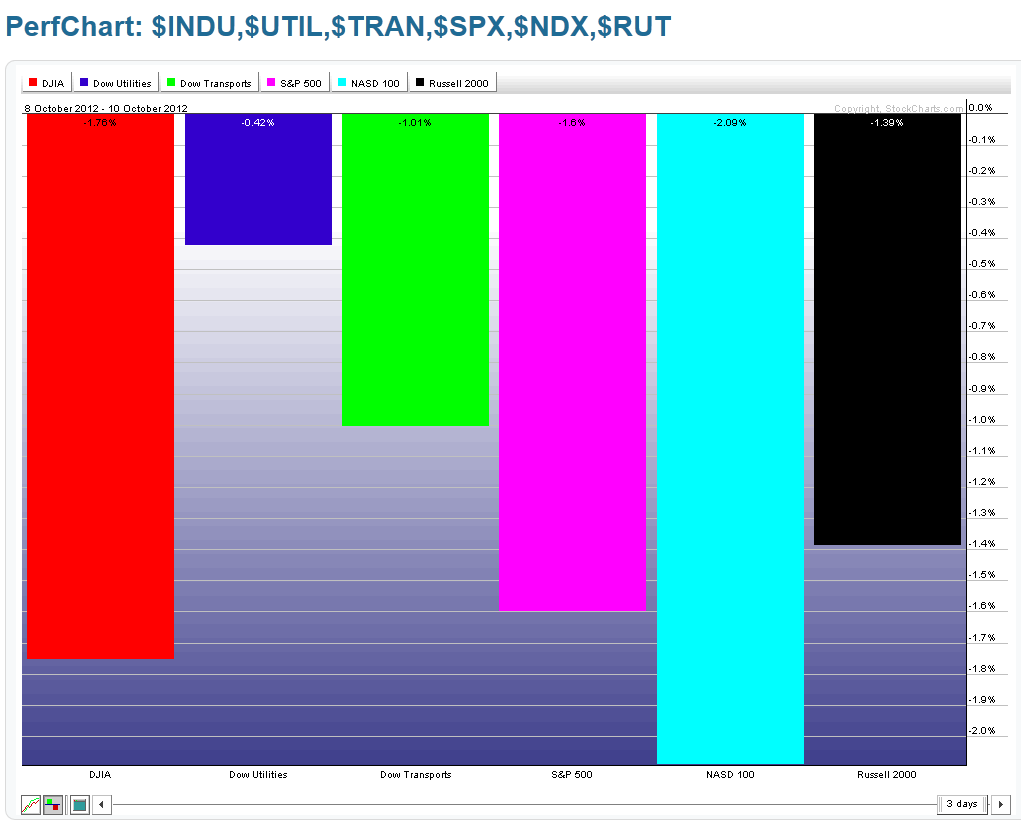
The Daily line chart of the 9 Major Sectors shows that the only ones that haven't yet closed at/near their lower Bollinger Band are Consumer Staples, Health Care, Utilities, and Financials. The only ones that made a higher swing closing high before this latest pullback are Consumer Staples, Health Care, and Utilities (the "Defensive" Sectors). 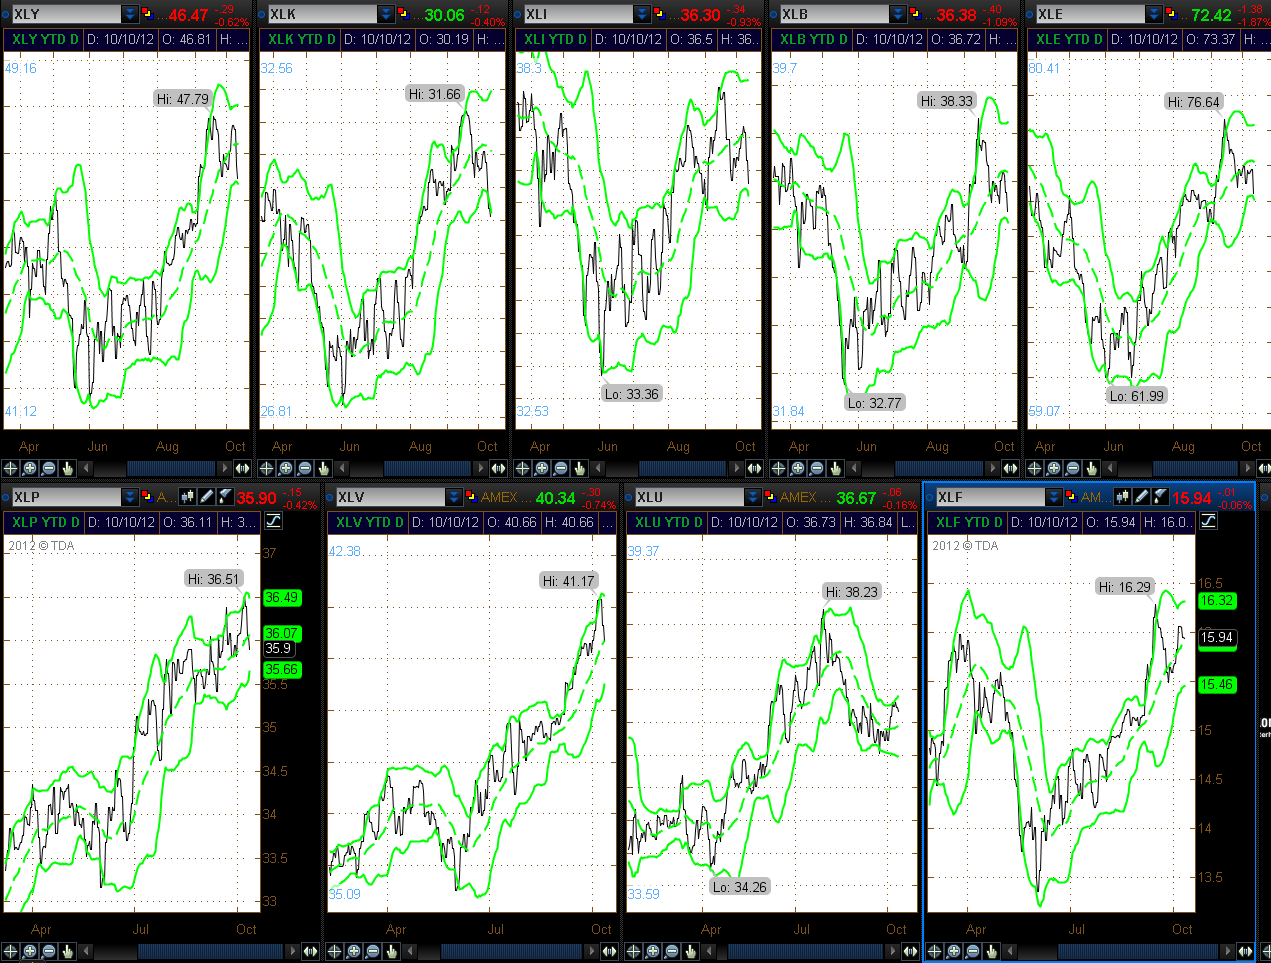
The 3-day percentages gained/lost graph shows that the largest losses have occurred in the Consumer Discretionary Sector, followed by Industrials, Materials, Health Care, Energy, and Technology. The sectors with the least losses are Utilities, followed by Financials, and Consumer Staples. While Health Care has only pulled back to its mid-Bollinger Band, it is still in the first group (the "Offensives") which has had the largest percentage losses. 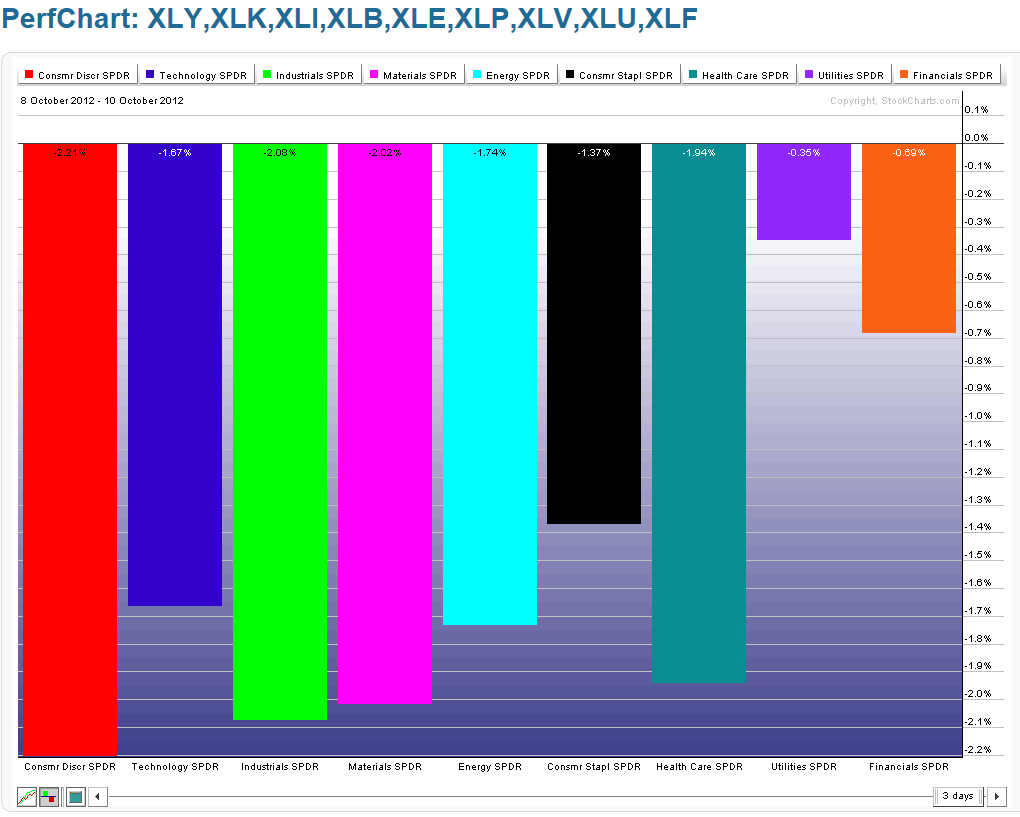
In summary, while there has been a general sell-off in the Large-Cap, Technology, and Small-Cap Indices in a "risk-off" environment by mid-week, the Dow Transports and Utilities have fared somewhat better, on a percentage-lost basis. They are the ones to watch for any signs of serious weakness, which may take them down to their lower Bollinger Band. If that happens, they may drag the other four Indices down further below their lower Bollinger Band, which may (or may not) hold for a day or two as short-term support. Also, since the Nasdaq 100 has lost the most, while the Russell 2000 has lost the least compared with the 4 Major Indices, they also hold the key and bear a close watch over the next couple of days to watch for either signs of an acceleration of weakness or evidence of stabilization or buying/short-covering.
In addition, the Sectors to watch for any signs of serious weakening are the "Defensive" and Financial Sectors. If that happens, they may drag the other Sectors down further below their lower Bollinger Band, which may (or may not) hold for a day or two as short-term support.
Finally, it's my opinion that any further serious sell-off below lower Bollinger Bands in all these Indices and Sectors would likely be accompanied by a general sell-off in commodities and foreign currencies. In this regard, 80.00 seems to be the level that would need to be held by the U.S. $, as shown on the Weekly chart below. Several intersecting Fibonacci fanlines, the 50 sma (red), the 200 sma (pink), the 5-Year Volume Profile POC (point-of-control), and price consolidation ranges all converge at this 80.00 level, so it's an important level to be captured by $ bulls and held as support.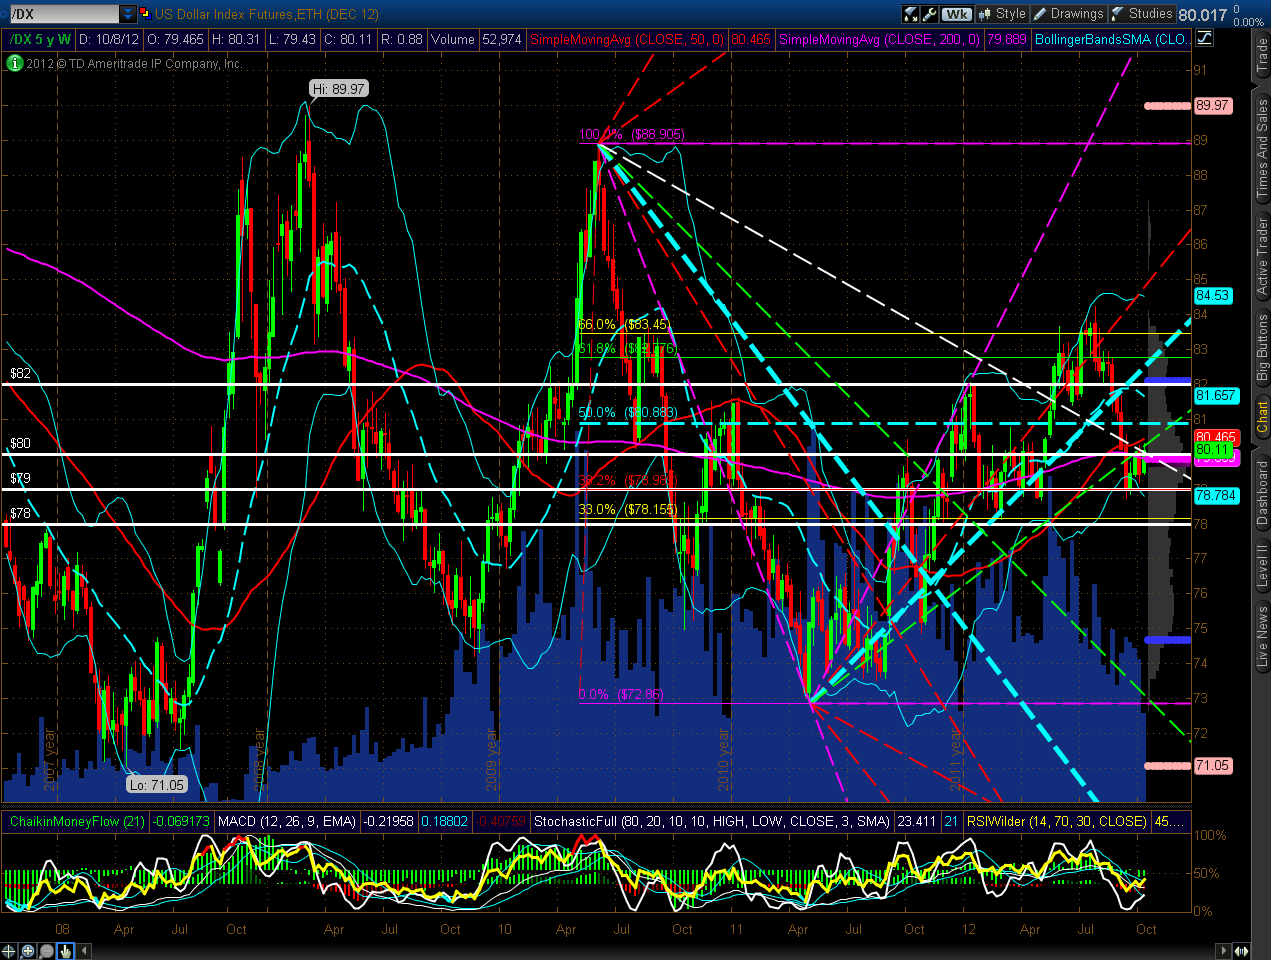
- English (UK)
- English (India)
- English (Canada)
- English (Australia)
- English (South Africa)
- English (Philippines)
- English (Nigeria)
- Deutsch
- Español (España)
- Español (México)
- Français
- Italiano
- Nederlands
- Português (Portugal)
- Polski
- Português (Brasil)
- Русский
- Türkçe
- العربية
- Ελληνικά
- Svenska
- Suomi
- עברית
- 日本語
- 한국어
- 简体中文
- 繁體中文
- Bahasa Indonesia
- Bahasa Melayu
- ไทย
- Tiếng Việt
- हिंदी
Relative Strength In This Week's Market Weakness
Published 10/11/2012, 01:39 AM
Updated 07/09/2023, 06:31 AM
Relative Strength In This Week's Market Weakness
3rd party Ad. Not an offer or recommendation by Investing.com. See disclosure here or
remove ads
.
Latest comments
Install Our App
Risk Disclosure: Trading in financial instruments and/or cryptocurrencies involves high risks including the risk of losing some, or all, of your investment amount, and may not be suitable for all investors. Prices of cryptocurrencies are extremely volatile and may be affected by external factors such as financial, regulatory or political events. Trading on margin increases the financial risks.
Before deciding to trade in financial instrument or cryptocurrencies you should be fully informed of the risks and costs associated with trading the financial markets, carefully consider your investment objectives, level of experience, and risk appetite, and seek professional advice where needed.
Fusion Media would like to remind you that the data contained in this website is not necessarily real-time nor accurate. The data and prices on the website are not necessarily provided by any market or exchange, but may be provided by market makers, and so prices may not be accurate and may differ from the actual price at any given market, meaning prices are indicative and not appropriate for trading purposes. Fusion Media and any provider of the data contained in this website will not accept liability for any loss or damage as a result of your trading, or your reliance on the information contained within this website.
It is prohibited to use, store, reproduce, display, modify, transmit or distribute the data contained in this website without the explicit prior written permission of Fusion Media and/or the data provider. All intellectual property rights are reserved by the providers and/or the exchange providing the data contained in this website.
Fusion Media may be compensated by the advertisers that appear on the website, based on your interaction with the advertisements or advertisers.
© 2007-2024 - Fusion Media Limited. All Rights Reserved.
