On November 8, Regency Energy Partners LP (RGP) reported results of operations for 3Q 2012. Revenues, operating income, net income and earnings before interest, depreciation and amortization and income tax expenses (EBITDA) for 3Q12, 3Q11 and for the trailing 12 months (“TTM”) are summarized in Table 1: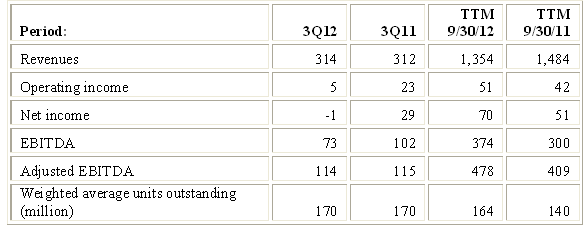
In 3Q12, operating income, net income and EBITDA decreased vs. the prior year period. The principal components of this decrease were: a ~$14 million (net) non-cash mark-to-market gain recorded in the prior year period; a ~$10 million non-cash asset impairment charge related to one of the joint ventures; and a ~$4 million decrease in total segment margin primarily due to the non-cash mark-to-market loss on outstanding derivatives during 3Q12.
RGP has 5 business segments: (1) Gathering and Processing provides “wellhead-to-market” services to producers of natural gas. This segment also includes RGP’s investment in Ranch JV, which processes natural gas delivered from shale formations in west Texas; (2) Contract Compression owns and operate a fleet of compressors used to provide turn-key natural gas compression services; (3) Contract Treating owns and operates a fleet of equipment used to provide treating services, such as carbon dioxide and hydrogen sulfide removal, natural gas cooling, dehydration and BTU management, to natural gas producers and midstream pipeline companies; (4) the Corporate and Others segment comprises a small regulated pipeline and our corporate offices; and (5) the Joint Ventures segment.
Segment margin performance of the first four segments in 3Q12 vs. 3Q11 and in the TTM ended 9/30/12 and 9/30/11 is summarized below: 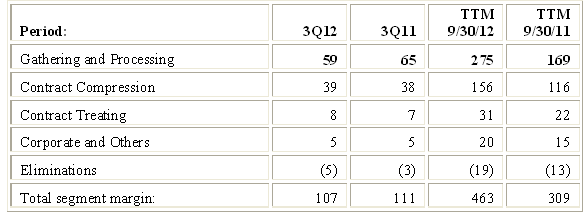
As indicated by Table 2, the TTM improvement in total segment margin has been driven by Gathering and Processing which benefitted from increased volumes in south and west Texas and north Louisiana. RGP does not record segment margin for the fifth segment, Joint Ventures, because it records its ownership percentages of the net income of its unconsolidated affiliates as income from unconsolidated affiliates in accordance with the equity method of accounting.
The Joint Ventures segment includes: (1) a 49.99% general partner interest in RIGS Haynesville Partnership Co.,(“HPC”), which owns a 450 mile intrastate pipeline that delivers natural gas from northwest Louisiana to downstream pipelines and markets; (2) a 50% membership interest in Midcontinent Express Pipeline LLC (“MEP”), which owns an interstate natural gas pipeline with approximately 500 miles stretching from southeast Oklahoma through northeast Texas, northern Louisiana and central Mississippi to an interconnect with the Transcontinental Gas Pipe Line system in Butler, Alabama; and (3) a 30% membership interest in Lone Star, an entity owning a diverse set of midstream energy assets including NGL pipelines, storage, fractionation and processing facilities located in the states of Texas, Mississippi and Louisiana. Income from these unconsolidated affiliates in 3Q12 vs. 3Q11 and in the TTM ended 9/30/12 and 9/30/11 is summarized below: 
As indicated by Table 3, the primary driver of the TTM improvement in total income from unconsolidated joint ventures is Lone Star which became operational in May 2011. Lone Star provided a twelve month contribution in the TTM ending 9/30/12 vs. a ~7 month contribution in the prior year period. On the other hand, HPC was adversely affected by the expiration of certain contracts not renewed and lower throughput. The primary reason given by shippers for not renewing their contracts is that they hold excess firm transportation capacity out of the Haynesville shale. This excess capacity is a result of moving drilling rigs out of the Haynesville area to richer gas plays which has slowed supply growth and contributed to a decrease in throughput.
Given quarterly fluctuations in revenues, working capital needs and other items, it makes sense to review TTM numbers rather than just quarterly numbers for the purpose of analyzing changes in reported and sustainable distributable cash flows.
RGP’s definition of Distributable Cash Flow (“DCF”) and a comparison to definitions used by other master limited partnerships (“MLPs”) are described in an article titled Distributable Cash Flow (DCF). Using that definition, DCF for the TTM period ending 9/30/12 was $324 million ($1.98 per unit), up from $271 million ($1.94 per unit) in the comparable prior year period.
As always, I first attempt to assess how these DCF figures compare with what I call sustainable DCF for these periods and whether distributions were funded by additional debt or issuing additional units. Given quarterly fluctuations in revenues, working capital needs and other items, it makes sense to review TTM numbers rather than quarterly numbers for the purpose of analyzing changes in reported and sustainable distributable cash flows.
The generic reasons why DCF as reported by the MLP may differ from sustainable DCF are reviewed in an article titled Estimating sustainable DCF-why and how. Applying the method described there to RGP’s results through 3Q12 generates the comparison outlined in Table 4 below: 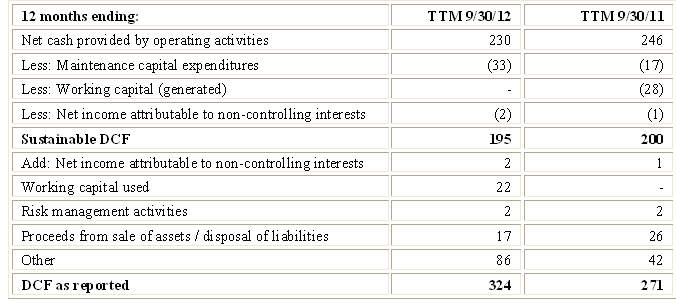
The principal differences between reported DCF and sustainable DCF relate to working capital, proceeds from asset sales, and RGP’s substantial, but non-controlling, stakes in the entities within its Joint Ventures segment.
Under RGP’s definition, reported DCF always excludes working capital changes, whether positive or negative. In contrast, as detailed in my prior articles, I generally do not include working capital generated in the definition of sustainable DCF but I do deduct working capital invested (this accounts for $22 million of the variance between reported and sustainable DCF in 3Q12). Despite appearing to be inconsistent, this makes sense because in order to meet my definition of sustainability the master limited partnerships should, on the one hand, generate enough capital to cover normal working capital needs. On the other hand, cash generated from working capital is not a sustainable source and I therefore ignore it. Over reasonably lengthy measurement periods, working capital generated tends to be offset by needs to invest in working capital. I therefore do not add working capital consumed to net cash provided by operating activities in deriving sustainable DCF. Similarly, I also do not add back into DCF items I do not regard as sustainable, such as proceeds from asset sales.
The largest variance between reported and sustainable DCF related to RGP’s substantial, but non-controlling, stakes in the entities within its Joint Ventures segment. Pursuant to Generally Accepted Accounting Principles (GAAP), the Partnership records its share of the net income in these other pipelines as income from unconsolidated affiliates in accordance with the equity method of accounting. However, for purposes of calculating DCF, RGP treats these as if they were fully consolidated by deducting its share of net income, adding its share of the EBITDA, and further adjusting to take into account its share of interest expense and maintenance capital expenditures.
On the one hand, I can accept classifying RGP’s share of cash flows generated from these entities in the sustainable category despite the fact that RGP does not control them (i.e., cannot determine what to do with the cash they generate). This is because they are similar in every other respect to RGP’s other pipeline assets and because RGP and/or Energy Transfer Equity, L.P. (ETE), RGP’s general partner, do exercise a significant degree of influence over them. On the other hand, RGP’s share of cash flows generated from these entities (which accounts for the bulk of the $86 million and the $42 million in the “Other” line item) does not, as of the date of the report, appear on RGP's balance sheet and does not increase RGP’s end-of-period cash balance.
Coverage ratios, with and without this line item, are as indicated in the table below: 
Whichever way you look at it, these are thin coverage ratios.
I find it helpful to look at a simplified cash flow statement by netting certain items (e.g., acquisitions against dispositions) and by separating cash generation from cash consumption.
Here is what I see for RGP: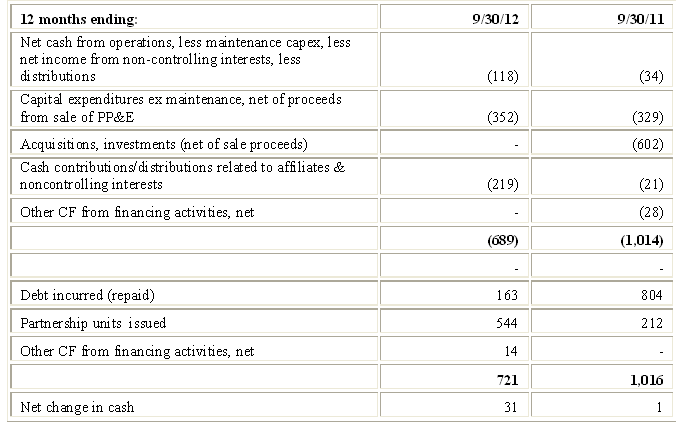
Net cash from operations, less maintenance capital expenditures, less net income from non-controlling interests did not cover distributions in both periods. The shortfall was $118 million for the TTM ending 9/30/12 and $34 million for the comparable prior year period. Table 6 therefore shows that distributions in both TTM periods were partially financed by issuing equity and debt, despite the fact that RGP’s reported DCF exceeded the amount distributed (as shown in Tables 4 and 5). The reason, as previously noted, is that reported DCF included items that never make it into the cash flow statement (i.e., cash flows from the non-consolidated pipelines and some other adjustments).
Growth capital expenditures in 2012, including capital contributions to RGP’s unconsolidated affiliates (i.e., the non-controlling, stakes in other pipelines), are expected to total ~$820 million, of which ~ $553 million was expended in the TTM ending 9/30/12. With long term debt at ~5.1x TTM EBITDA and over $260 million of growth capital expenditures required in 4Q12, I would not be surprised to see additional equity issued this quarter. The projects being financed will begin to impact RGP’s results only in 2013-2014.
Energy Transfer Equity, L.P. (ETE) is RGP’s general partner and holds ~17% of the limited partner units., ETE is entitled, via its incentive distribution rights (“IDRs”), to 23% of RGP’s current quarterly distribution of $0.46 per units. Distributions have not grown since 1Q12, but investors should be aware that ETE’s IDRs increase from 23% to 48% once distributions cross the threshold of $0.525 per quarter. RGP is at a significant disadvantage in terms of cost of capital compared to MLPs who have eliminated IDRs altogether. Roughly speaking, an incremental project must generate ~15.4% cash return of which ~7.4% (48%) would be distributed to ETE and ~8% to the limited partners.
Table 7 below compares RGP’s current yield of some of the other MLPs I follow: 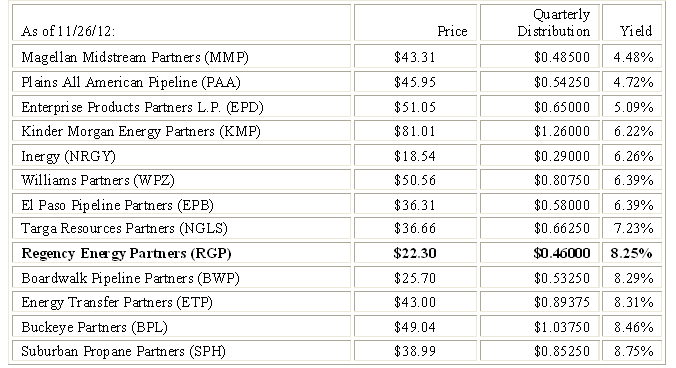
In light of the low coverage ratio, the relatively high leverage and my discomfort with the structural complexity surrounding ETE and ETP, I would stay on the sidelines despite the attractive yield.
- English (UK)
- English (India)
- English (Canada)
- English (Australia)
- English (South Africa)
- English (Philippines)
- English (Nigeria)
- Deutsch
- Español (España)
- Español (México)
- Français
- Italiano
- Nederlands
- Português (Portugal)
- Polski
- Português (Brasil)
- Русский
- Türkçe
- العربية
- Ελληνικά
- Svenska
- Suomi
- עברית
- 日本語
- 한국어
- 简体中文
- 繁體中文
- Bahasa Indonesia
- Bahasa Melayu
- ไทย
- Tiếng Việt
- हिंदी
Regency Energy Partners' Distributable Cash Flow
Published 11/28/2012, 10:50 AM
Updated 07/09/2023, 06:31 AM
Regency Energy Partners' Distributable Cash Flow
3rd party Ad. Not an offer or recommendation by Investing.com. See disclosure here or
remove ads
.
Latest comments
Install Our App
Risk Disclosure: Trading in financial instruments and/or cryptocurrencies involves high risks including the risk of losing some, or all, of your investment amount, and may not be suitable for all investors. Prices of cryptocurrencies are extremely volatile and may be affected by external factors such as financial, regulatory or political events. Trading on margin increases the financial risks.
Before deciding to trade in financial instrument or cryptocurrencies you should be fully informed of the risks and costs associated with trading the financial markets, carefully consider your investment objectives, level of experience, and risk appetite, and seek professional advice where needed.
Fusion Media would like to remind you that the data contained in this website is not necessarily real-time nor accurate. The data and prices on the website are not necessarily provided by any market or exchange, but may be provided by market makers, and so prices may not be accurate and may differ from the actual price at any given market, meaning prices are indicative and not appropriate for trading purposes. Fusion Media and any provider of the data contained in this website will not accept liability for any loss or damage as a result of your trading, or your reliance on the information contained within this website.
It is prohibited to use, store, reproduce, display, modify, transmit or distribute the data contained in this website without the explicit prior written permission of Fusion Media and/or the data provider. All intellectual property rights are reserved by the providers and/or the exchange providing the data contained in this website.
Fusion Media may be compensated by the advertisers that appear on the website, based on your interaction with the advertisements or advertisers.
© 2007-2024 - Fusion Media Limited. All Rights Reserved.
