
Premium machine tools & accessories company RBC Bearings Inc. (NASDAQ:ROLL) reported mixed first-quarter fiscal 2017 results, wherein earnings missed and sales beat estimates.
Diluted earnings for the quarter came in at 77 cents per share, a penny lower than both the Zacks Consensus Estimate and the year-ago figure.
Revenues
Net sales of $154.6 million jumped 8.6% year over year. The upside was driven by strong business in the aerospace sector, both in terms of aftermarket activity and commercial original equipment manufacturing. Also, improved marine trade supported top-line growth by increasing the company’s industrial sales.
Quarterly revenues also narrowly surpassed the Zacks Consensus Estimate of $153 million.
Margins/Costs
RBC Bearings’ cost of sales during the quarter was $97.3 million, up 8.7% year over year. This metric represents 63% of aggregate revenues.
Adjusted gross margin contracted 140 basis points (bps) year over year to 37.3%. Total operating expenses were $28 million, down 7.8% year over year.
RBC Bearings exited the quarter with backlog of $352.6 million compared with $340.8 million as of Jun 27, 2015.
Segmental Performance
Plain Bearings revenues grew 7.3% year over year to $70.5 million, whereas Roller Bearings sales fell 9% to $27.8 million. Ball Bearings sales were $13.7 million, up 7% year over year. Engineered Products sales surged 28.1% year over year to $42.6 million.
Other Financial Fundamentals
RBC Bearings exited the quarter with total debt of $343.8 million, lower than $427.4 million in the year-ago comparable period.
In fiscal first quarter, RBC Bearings generated $19.2 million of cash from its operating activities as against $22.2 million in the prior-year quarter. Capital spending declined 2% year over year to $5.2 million.
Outlook
RBC Bearings continues to project a positive outlook. The company expects that its latest acquisitions would further support growth in revenues and margins going ahead. The company also intends to enhance its earnings and backlog through greater operational efficiency in the future.
As of Aug 4, 2016 RBC Bearings closed the trading session at $78.28 per share. However it remains to be seen how the stock performs after posting the fiscal first-quarter results.
RBC BEARINGS Price, Consensus and EPS Surprise
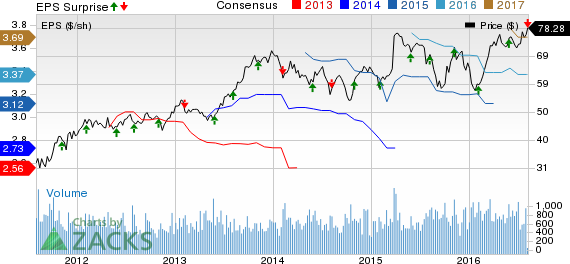
RBC BEARINGS Price, Consensus and EPS Surprise | RBC BEARINGS Quote
Stocks to Consider
RBC Bearings presently carries a Zacks Rank #3 (Hold). Some better-ranked stocks in the industry include Gorman-Rupp Co. (NYSE:GRC) , Tennant Company (NYSE:TNC) and Illinois Tool Works Inc. (NYSE:ITW) . Both Gorman-Rupp and Tennant Company sport a Zacks Rank #1 (Strong Buy), while Illinois Tool Works currently carries a Zacks Rank #2 (Buy).
Want the latest recommendations from Zacks Investment Research? Today, you can download 7 Best Stocks for the Next 30 Days.Click to get this free report >>
ILL TOOL WORKS (ITW): Free Stock Analysis Report
TENNANT CO (TNC): Free Stock Analysis Report
GORMAN RUPP CO (GRC): Free Stock Analysis Report
RBC BEARINGS (ROLL): Free Stock Analysis Report
Original post
Zacks Investment Research